Science Prediction Universe
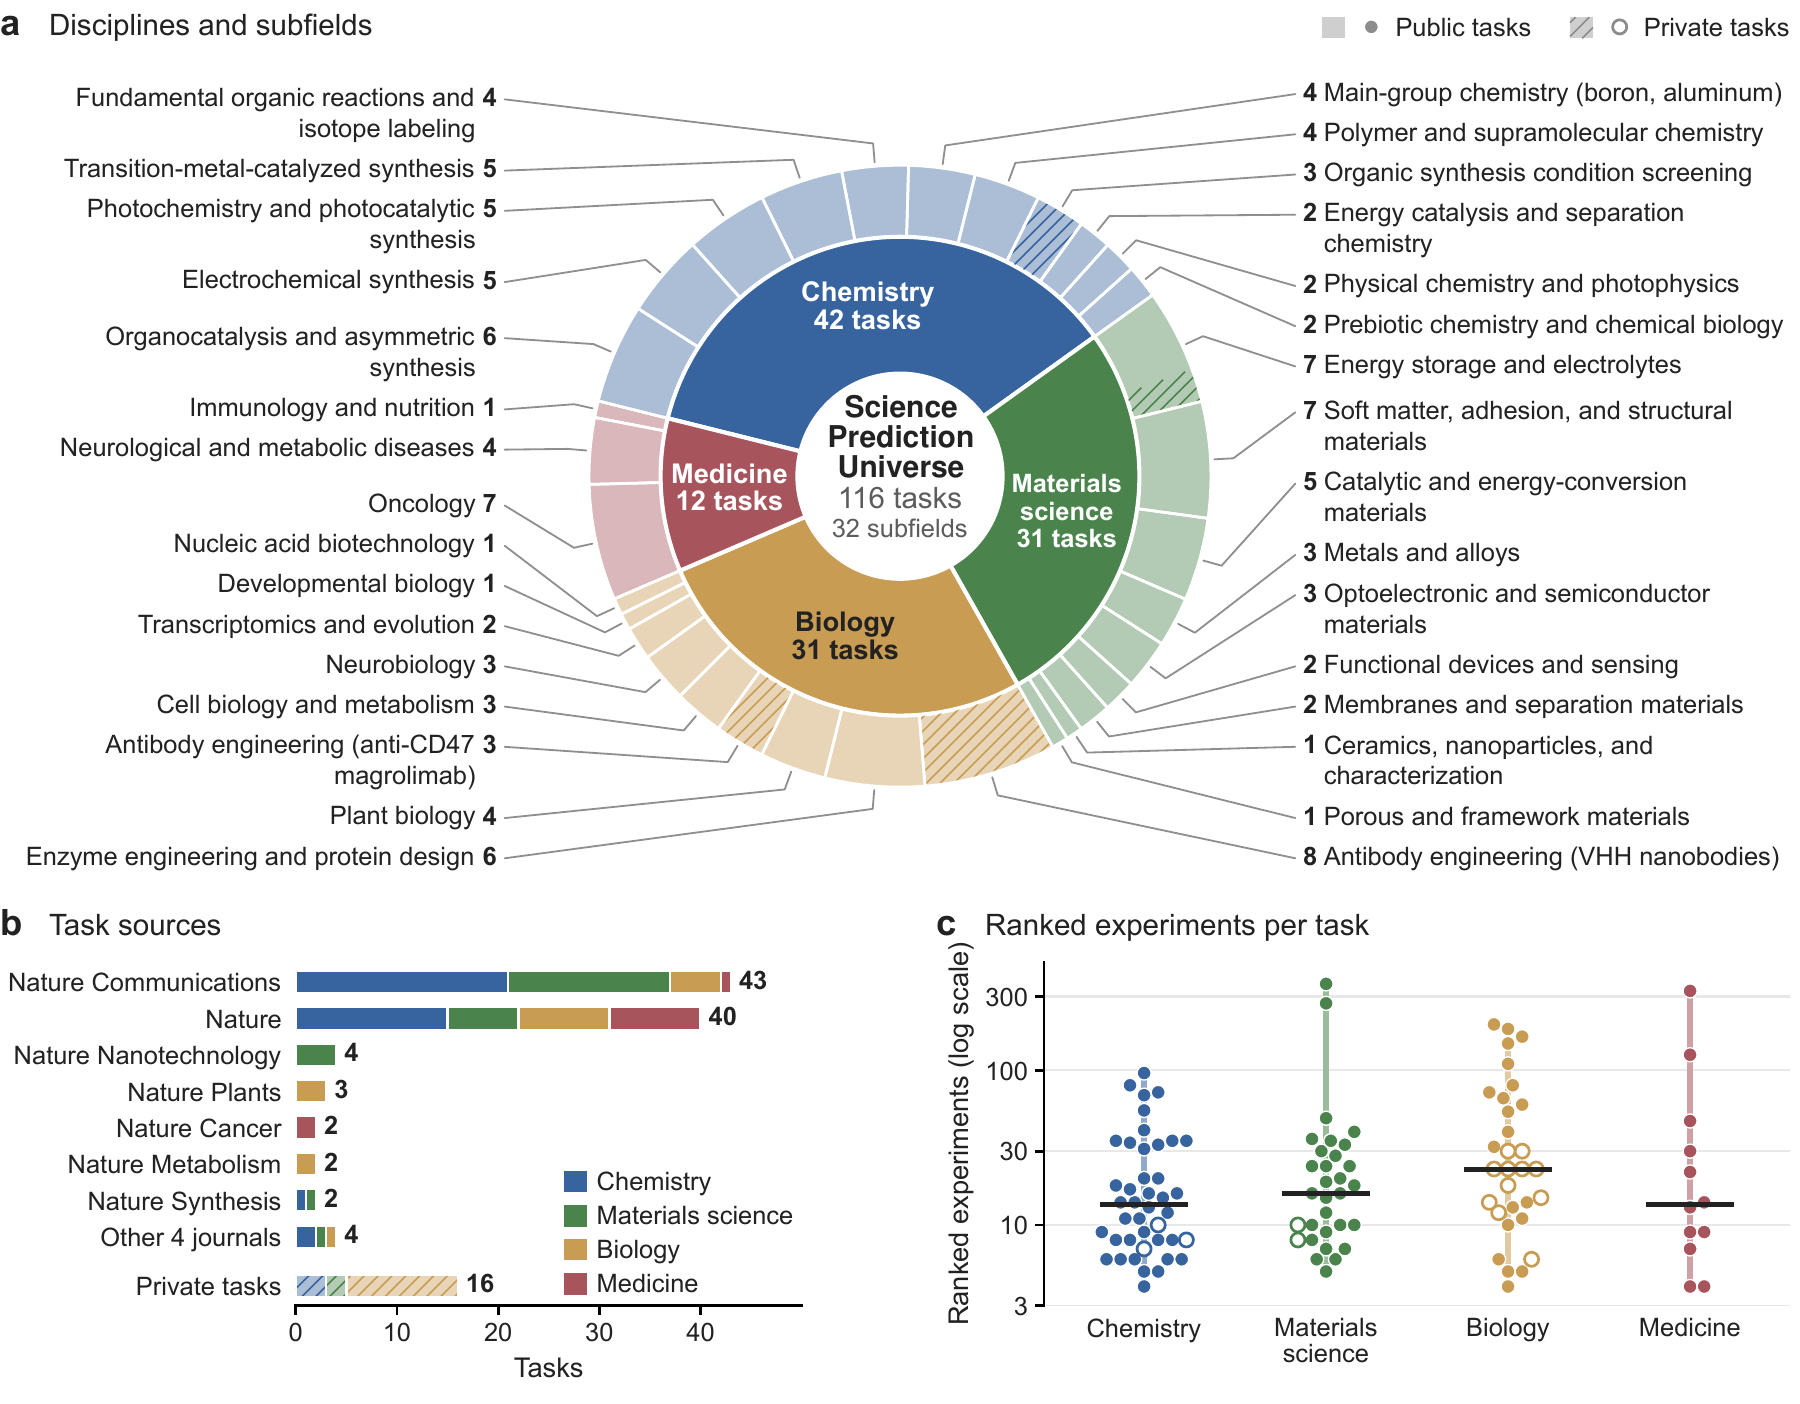
Science advances by prediction: a theory earns trust when it correctly foresees what an experiment not yet performed will show. Science Prediction Universe (SPU) asks whether an AI agent can do this for real wet-lab experiments, using only what a scientist knows before running them, and scores it against measurements it never sees. SPU has 100 public tasks built from recent Nature Portfolio papers and 16 private tasks from experiments that have never been published.
“If it disagrees with experiment, it’s wrong. In that simple statement is the key to science.”
Richard Feynman
What SPU measures
AI agents can now search the literature, run quantum-chemistry and molecular-dynamics calculations, and write analysis code for hours on their own. Yet many questions in experimental science have no computed answer. Which electrolyte additive makes a zinc battery last longer? Which enzyme variant pushes an oxidation toward the desired product? Computation can narrow the candidates, but the answer comes from synthesis and measurement. SPU tests whether an agent can decide which evidence and which calculations matter for the quantity being measured, and then commit to a prediction without any experimental feedback.
Tasks: 100 public, 16 private
Source papers in 11 Nature Portfolio journals
Ranked wet-lab experiments
Per run, with open web and one H20 GPU
Other benchmarks cover parts of this. Outcome-prediction benchmarks such as BrainBench ask about real experimental results, usually as a single question to a model without tools. Agentic science benchmarks let agents write and run code on data that is already in hand, and long-horizon container benchmarks grade answers with fixed tests. SPU gives an agent hours of compute and open web access and scores it against real wet-lab measurements.
How SPU compares with related benchmarks
| Benchmark | Domain | Output | Wet-lab outcome | Agentic compute | Hours-long runs | Open web |
|---|---|---|---|---|---|---|
| Humanity's Last Exam | Multi-discipline | Closed-ended QA | ✗ | ✗ | ✗ | ✗ |
| BrainBench | Neuroscience | 2-way choice | ✓ | ✗ | ✗ | ✗ |
| SciPredict | Phys. / Chem. / Bio. | Answer or value | ✓ | ✗ | ✗ | ✗ |
| ProteinGym | Protein fitness | Spearman ranking | ✓ | ✗ | ✗ | ✗ |
| AssayBench † | CRISPR screens | Gene ranking | ✓ | △ | ✗ | ✗ |
| ScienceAgentBench | Data-driven science | Program | ✗ | ✓ | ✗ | ✗ |
| Terminal-Bench-Science | Five scientific domains | Tested artifact | ✗ | ✓ | n/s | n/s |
| Agents' Last Exam | Tool-use tasks | Task state or answer | ✗ | ✓ | ✓ | △ |
| Terminal-Bench 4.0 | Mixed | Tested state | ✗ | ✓ | ✓ | △ |
| Long-Horizon-TB | Mixed | Graded subtasks | ✗ | ✓ | ✓ | n/s |
| SPU (ours) | Chem. / Mat. / Bio. / Med. | Ranking | ✓ | ✓ | ✓ | ✓ policy + screening |
✓ yes · △ partly · ✗ no · n/s not stated. △ under Open web: web access is allowed and the agent is told not to look up answers, but this is not audited. † AssayBench evaluates agent baselines alongside direct LLM prediction. The columns show what SPU is designed to test; several of these benchmarks are stronger on things not shown here, such as scale, human baselines or prospective design.
How SPU builds and scores tasks
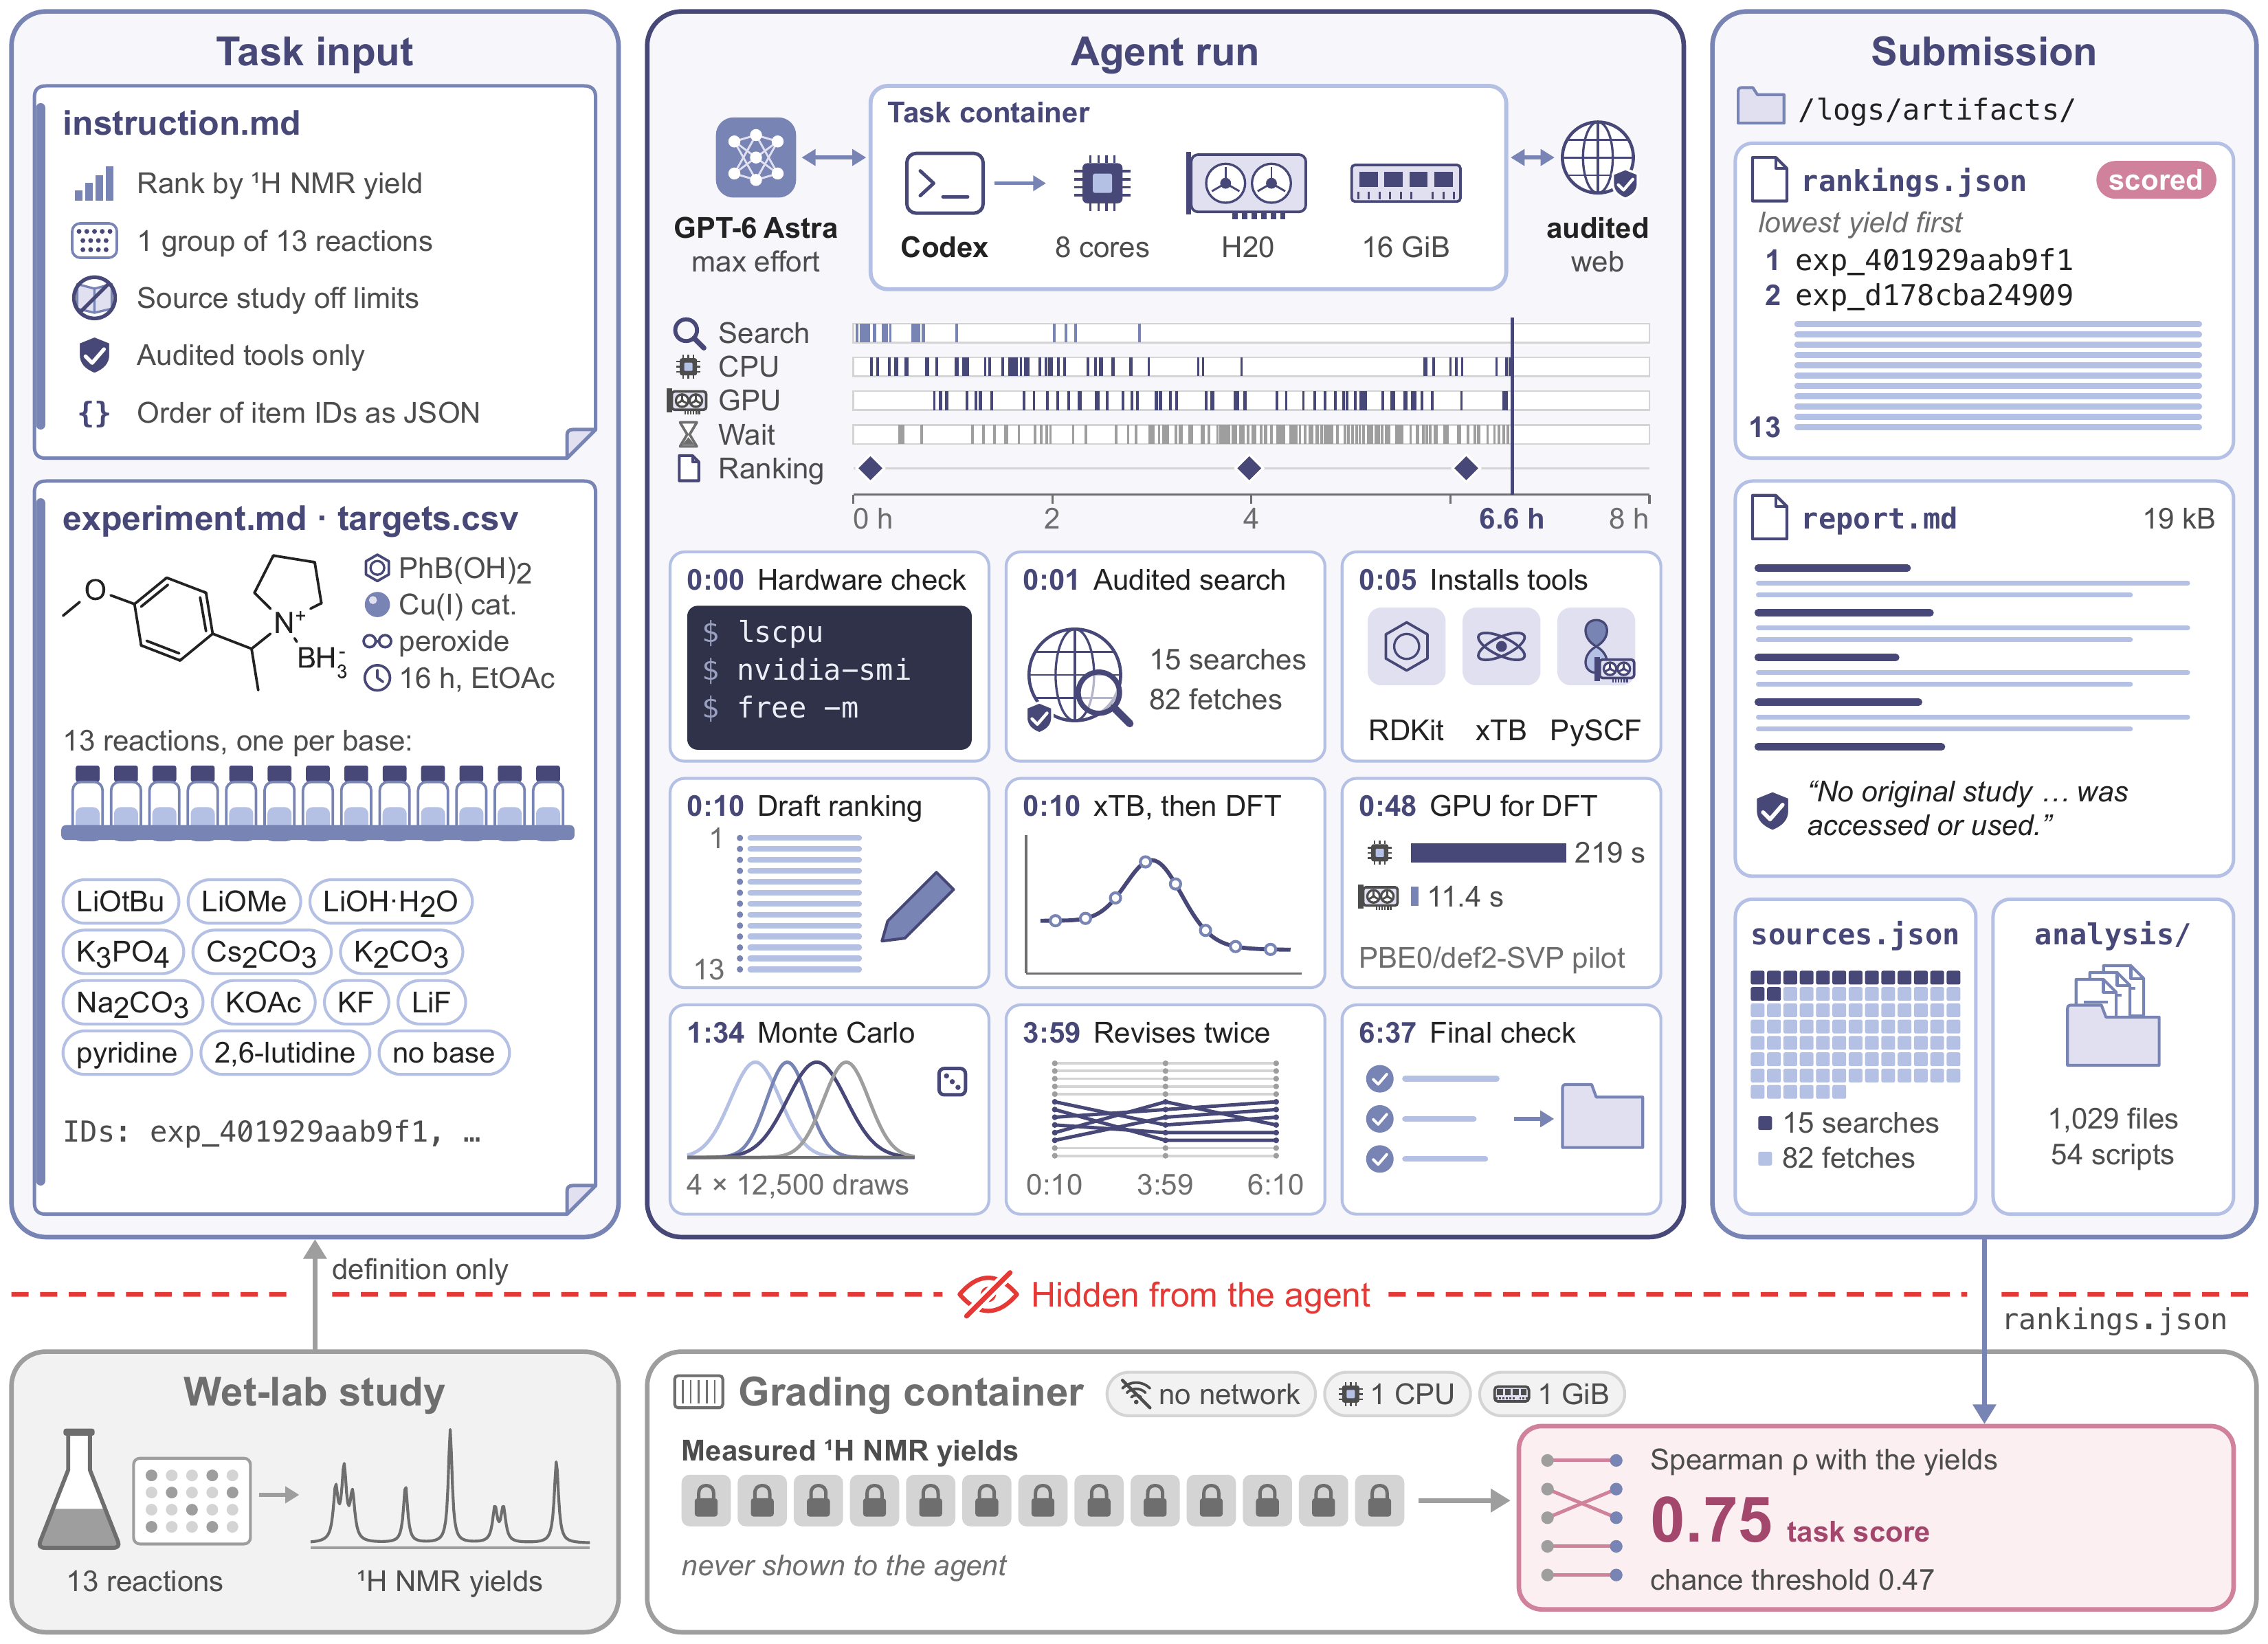
Every SPU task comes from a real wet-lab study. A task describes a set of experiments from one study: the candidates, the materials and conditions, and how the result was measured. The experiments are split into comparison groups, each with a single measured quantity such as a reaction yield or an ionic conductivity, and the agent orders each group from the lowest to the highest value.
More than ten domain experts built the 100 public tasks from studies that report full measurements. They left out two kinds of comparison: those that simply follow a trend, such as a concentration series, which a guess would get right, and those whose values are so close that the order could come from measurement error. Each task was reviewed independently against its sources, and the final 100 were chosen after pilot runs with agents. The 16 private tasks come from four series of unpublished experiments run with partner labs, on VHH nanobodies, reaction conditions, electrolytes and variants of the antibody Magrolimab. All were measured with replicates, and no model scores were used to choose them.
To leave the agent nothing to copy, each experiment carries an anonymous ID, all experiments are described in one neutral format, their order within a group is shuffled, and the agent is never told which study the task comes from. The agent works alone for up to eight hours in a container with 8 CPU cores, 16 GiB of memory and one NVIDIA H20 GPU, and it can search the literature and run scientific software online.
When the agent stops, a separate container without network access, which the agent never reaches, scores the ranking against the measurements. The score is the Spearman correlation between the submitted and the measured order: random rankings average 0, and a perfect ranking scores 1 (slightly less on a few tasks with tied measurements). Small tasks can score well by luck, so each task also has a chance threshold, the score that only 5% of 4,000 random rankings exceed; “above chance” in this post means above that threshold. Scoring is automatic, and no model acts as a judge.
How do current agents compare?
We tested twelve frontier models in thirteen configurations, where a configuration is a model with its reasoning effort and agent harness. GPT-6 Astra ran in Codex at medium and at max reasoning effort. GPT-6.1 Sol also ran in Codex, and the other ten models ran in Claude Code, all at max effort. The main comparison uses one official run per configuration on every task.
Best score on the public tasks (task-adjusted Spearman)
Share of scored tasks above chance, across configurations
Configurations above chance on the private tasks
Longer median runs at max effort, with no detectable score gain
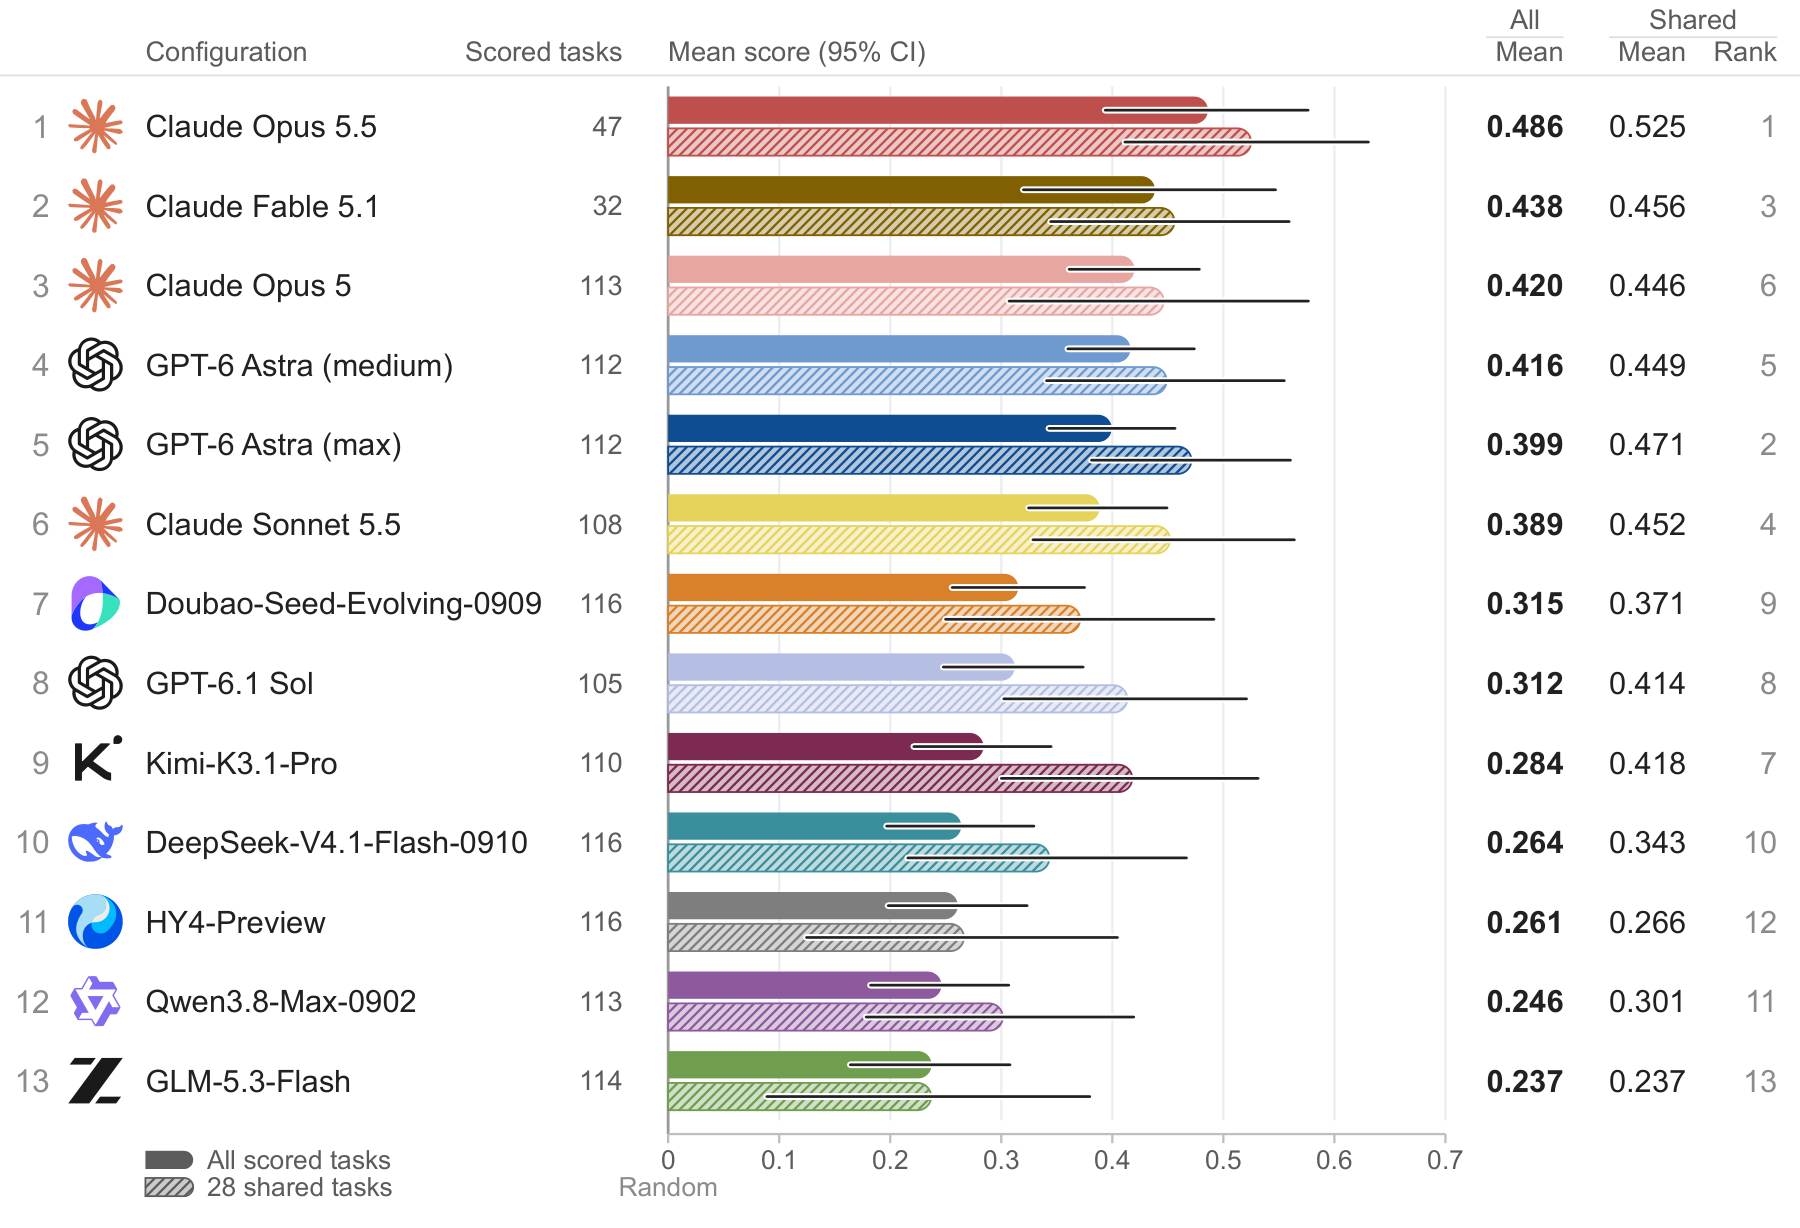
SPU is far from solved. Even the best configurations beat chance on only about half of their scored tasks. The point estimates form two broad groups: every difference that holds up statistically (17 pairs after Holm correction) separates configurations in the leading six from those in the other seven, and one run per task is not enough to order the configurations within a tier. Claude Opus 5.5 and Claude Fable 5.1 were scored on fewer tasks because of frequent safety refusals, especially outside materials science, so their averages rest mostly on materials-science tasks.
| # | Configuration | Harness | Scored tasks | Task-adjusted mean [95% CI] | Above chance |
|---|---|---|---|---|---|
| 1 | Claude Opus 5.5 | Claude Code | 44 | 0.478 [0.395, 0.564] | 23 (52%) |
| 2 | GPT-6 Astra (medium) | Codex | 100 | 0.431 [0.373, 0.486] | 52 (52%) |
| 3 | Claude Opus 5 | Claude Code | 99 | 0.424 [0.361, 0.487] | 51 (52%) |
| 4 | Claude Fable 5.1 | Claude Code | 30 | 0.421 [0.326, 0.508] | 14 (47%) |
| 5 | GPT-6 Astra (max) | Codex | 100 | 0.409 [0.352, 0.466] | 50 (50%) |
| 6 | Claude Sonnet 5.5 | Claude Code | 97 | 0.393 [0.328, 0.457] | 46 (47%) |
| 7 | Doubao-Seed-Evolving-0909 | Claude Code | 100 | 0.315 [0.250, 0.377] | 37 (37%) |
| 8 | GPT-6.1 Sol (max) | Codex | 94 | 0.308 [0.246, 0.371] | 35 (37%) |
| 9 | Kimi-K3.1-Pro | Claude Code | 95 | 0.296 [0.230, 0.361] | 34 (36%) |
| 10 | DeepSeek-V4.1-Flash-0910 | Claude Code | 100 | 0.254 [0.183, 0.323] | 36 (36%) |
| 11 | HY4-Preview | Claude Code | 100 | 0.245 [0.176, 0.313] | 36 (36%) |
| 12 | GLM-5.3-Flash | Claude Code | 98 | 0.239 [0.164, 0.312] | 33 (34%) |
| 13 | Qwen3.8-Max-0902 | Claude Code | 98 | 0.227 [0.157, 0.296] | 35 (36%) |
Public tasks only. Configurations were scored on different sets of tasks, so each mean is adjusted for task difficulty; brackets give 95% bootstrap intervals over tasks. Above chance counts the tasks where a configuration beat the task's chance threshold.
On the 28 tasks scored by all thirteen configurations—27 public and one private—the leading six still hold the first six places, in a different order. This common set reproduces the two groups without settling the order within each.
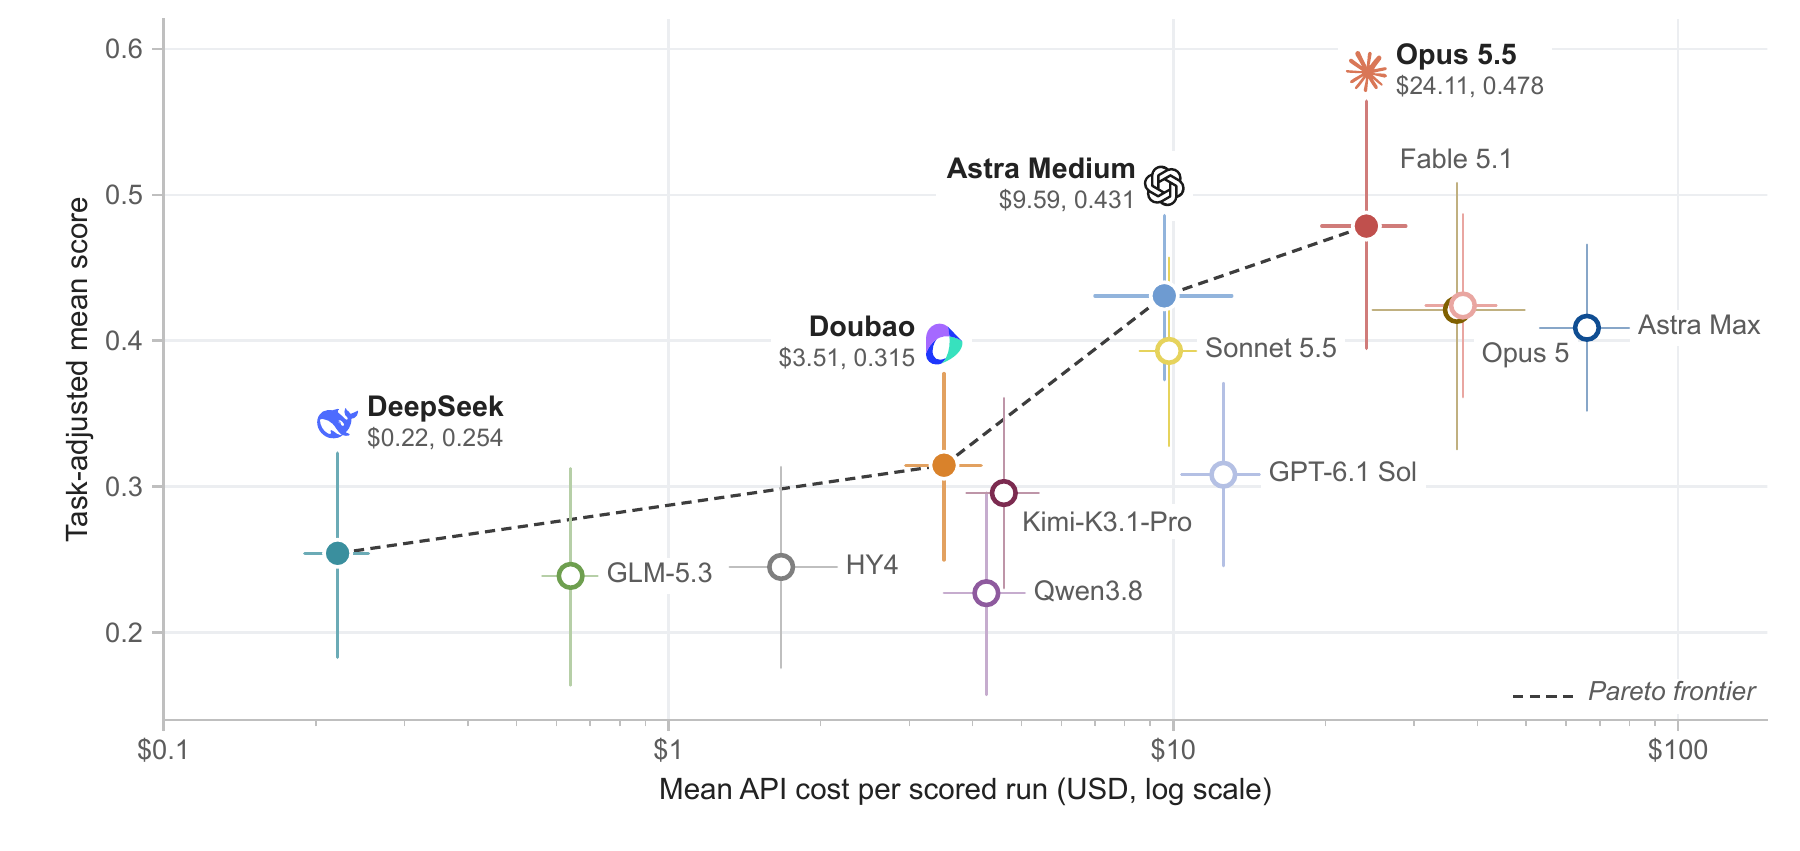
The average API cost of a scored run ranges 300-fold across configurations. DeepSeek-V4.1-Flash-0910, Doubao-Seed-Evolving-0909, GPT-6 Astra (medium) and Claude Opus 5.5 form the cost-performance frontier: for each of them, no other configuration is both cheaper and better. Among the five cheapest configurations, the biggest spender has the lowest score.
What separates the leading six from the other seven?
The thirteen configurations fall into two groups: a leading six and the other seven. On the same tasks the leading six score 0.15 higher on average, and the gap is widest at the bottom, because the leading six rarely fail outright: only 9% of their runs score below zero, against 22% of the other seven’s.
To see where the gap comes from, we looked at the experiments in pairs. A pair counts as correct when the agent puts it in the measured order. As a reference we use the consensus, the average of the rankings that the other configurations submitted on the same task, which stands for the intuition the models share.
Where the consensus is right, the other seven lose more of it: of every 100 such pairs, the leading six keep about 86 in the measured order and the other seven about 78. Where the consensus is wrong, both groups correct only about 30 in 100 (b). The other seven also break from the consensus more often, and only 38% of their departures are correct; the leading six are right on about half of theirs, and only Claude Opus 5.5 clearly more, at 63% (c). The pairs the other seven get wrong are often far apart in the measured order: experiments whose results differ widely, put the wrong way round (d).
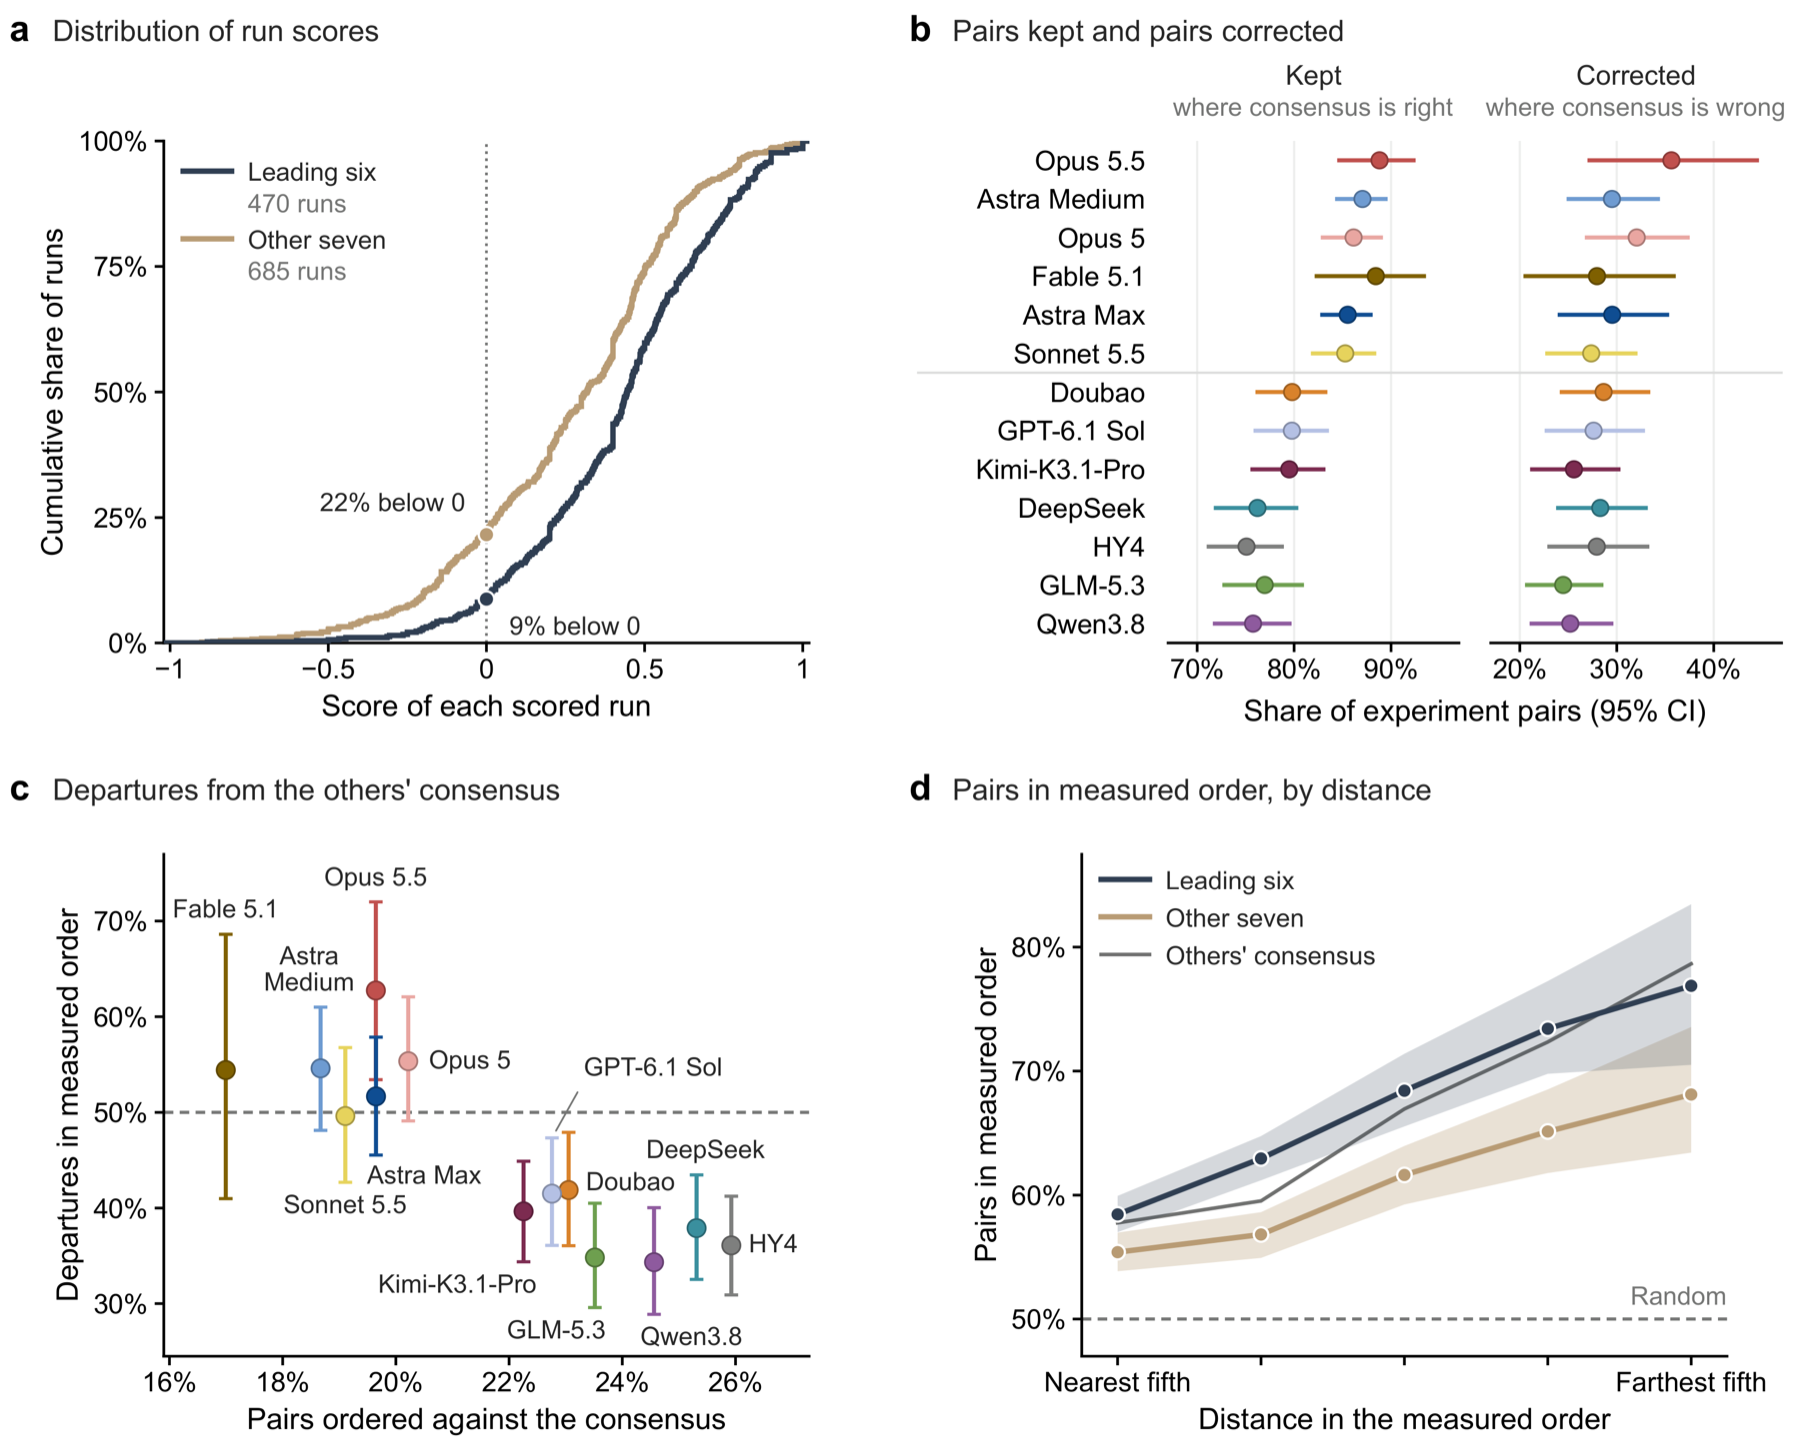
Reading the runs, we found three abilities behind the gap. The first is knowing when to trust a calculation and when to keep to common sense. The second is working out how the quantity being computed relates to the one being measured, and in which direction. The third, on tasks where common sense fails, is finding the mechanism that actually controls the measurement. The third varies most between models and accounts for much of the gap.
How agents spend a run
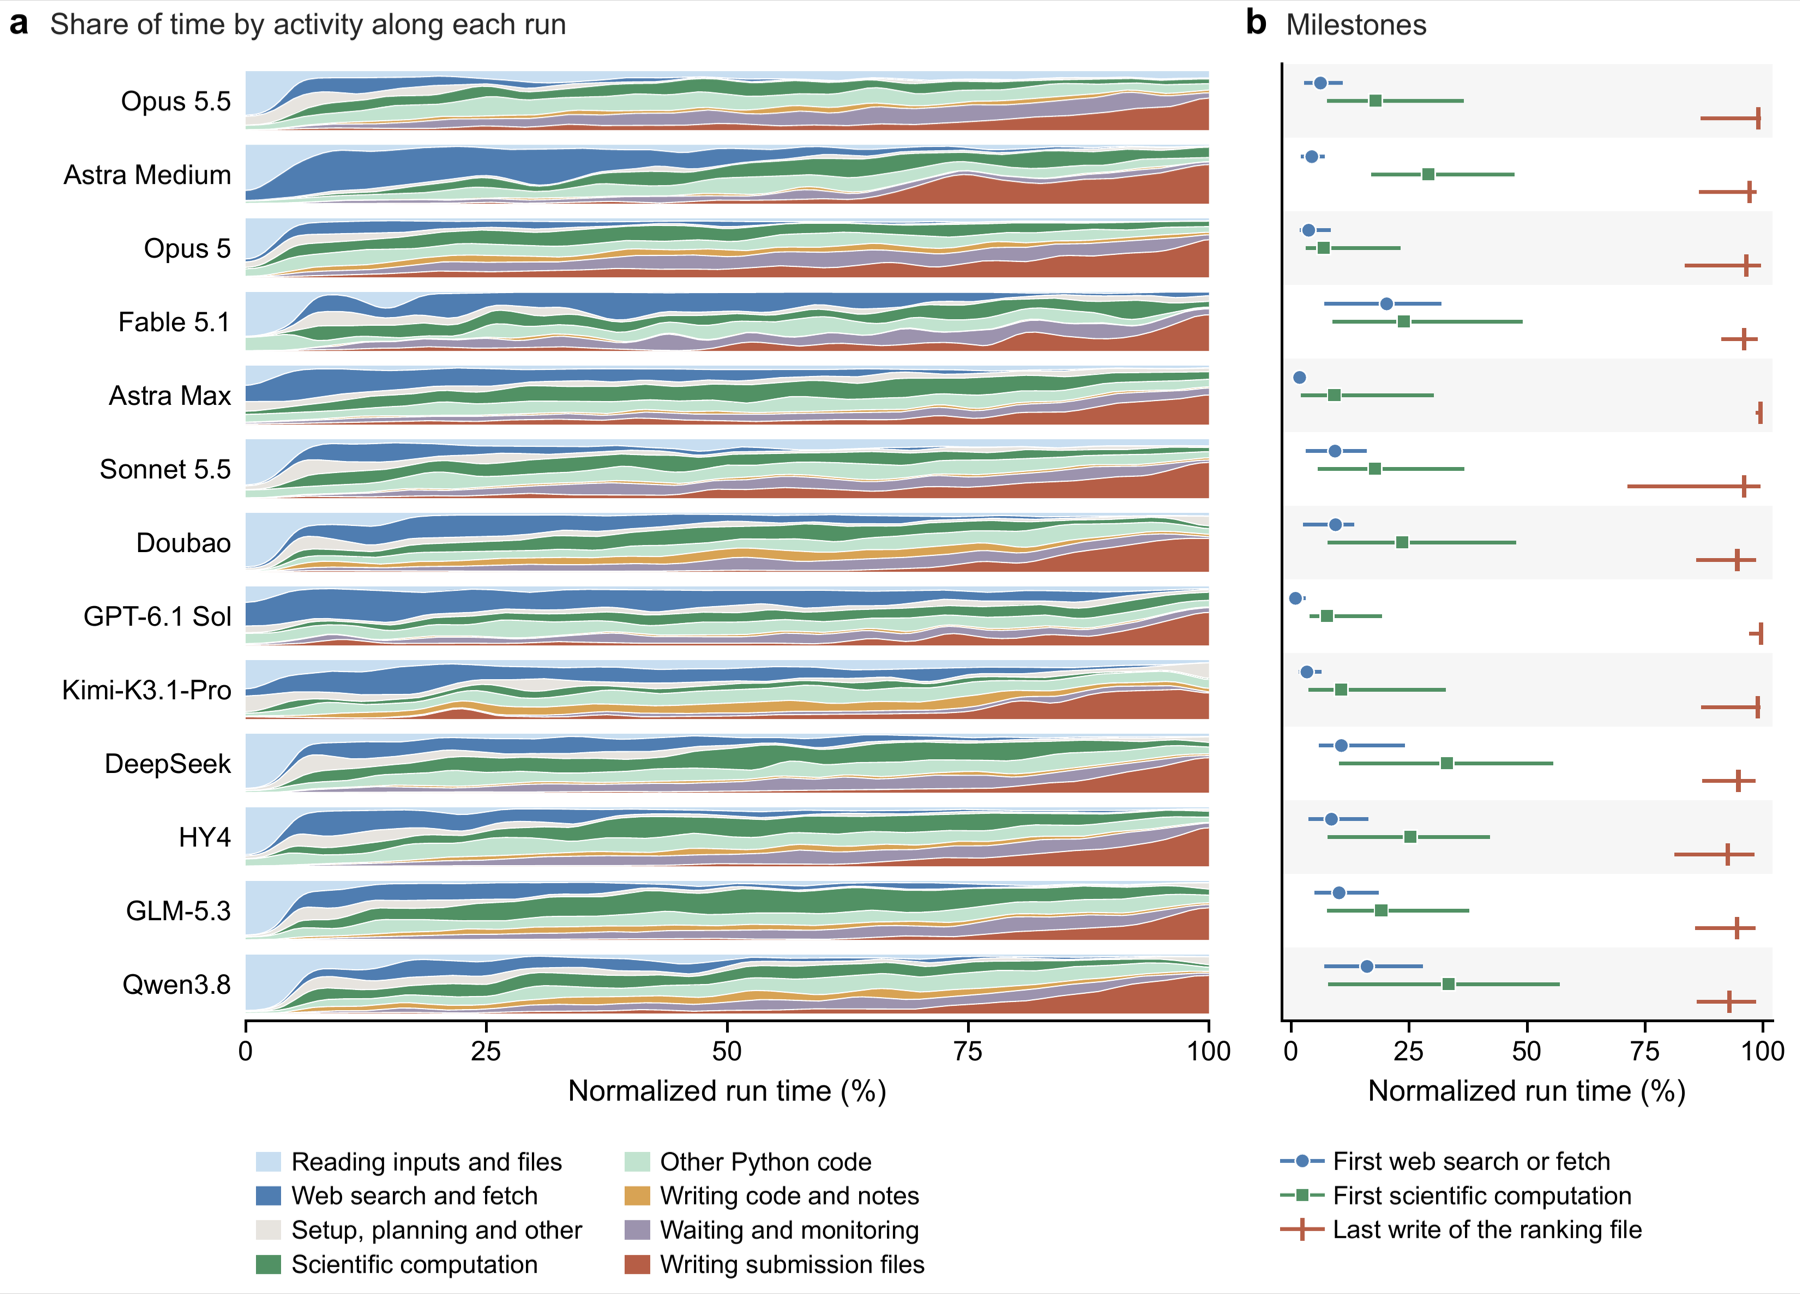
We analyzed all 1,155 scored runs on the public tasks, 227,103 tool calls in total. A run has a consistent shape across the thirteen configurations (a). Reading the task inputs fills most of the first 5% of run time, web search and fetch peak within the first quarter, scientific computation leads in the middle, and writing the submission files takes over in the last tenth.
Where the time goes differs. GPT-6 Astra (medium) and GPT-6.1 Sol spend about 30% of a run on the web, against 6% for Claude Opus 5.5; the first web access comes at a median of 1% to 20% of the run (b); and 17% of DeepSeek runs never call the search or fetch tools.
The clearest difference is when a configuration commits to a complete ranking. Claude Opus 5.5, GPT-6.1 Sol, Claude Opus 5, Claude Fable 5.1, Claude Sonnet 5.5, GPT-6 Astra (max) and Kimi-K3.1-Pro write one at a median of 10% to 32% of the run and keep working on it, for a median of 1.7 hours afterwards in Opus 5.5 and 3.7 hours in GPT-6.1 Sol. DeepSeek, Qwen3.8, GLM-5.3, Doubao and GPT-6 Astra (medium) write theirs at 84% to 87% of the run, close to the end; a median Doubao run writes its ranking file once.
Each discipline has a different leader
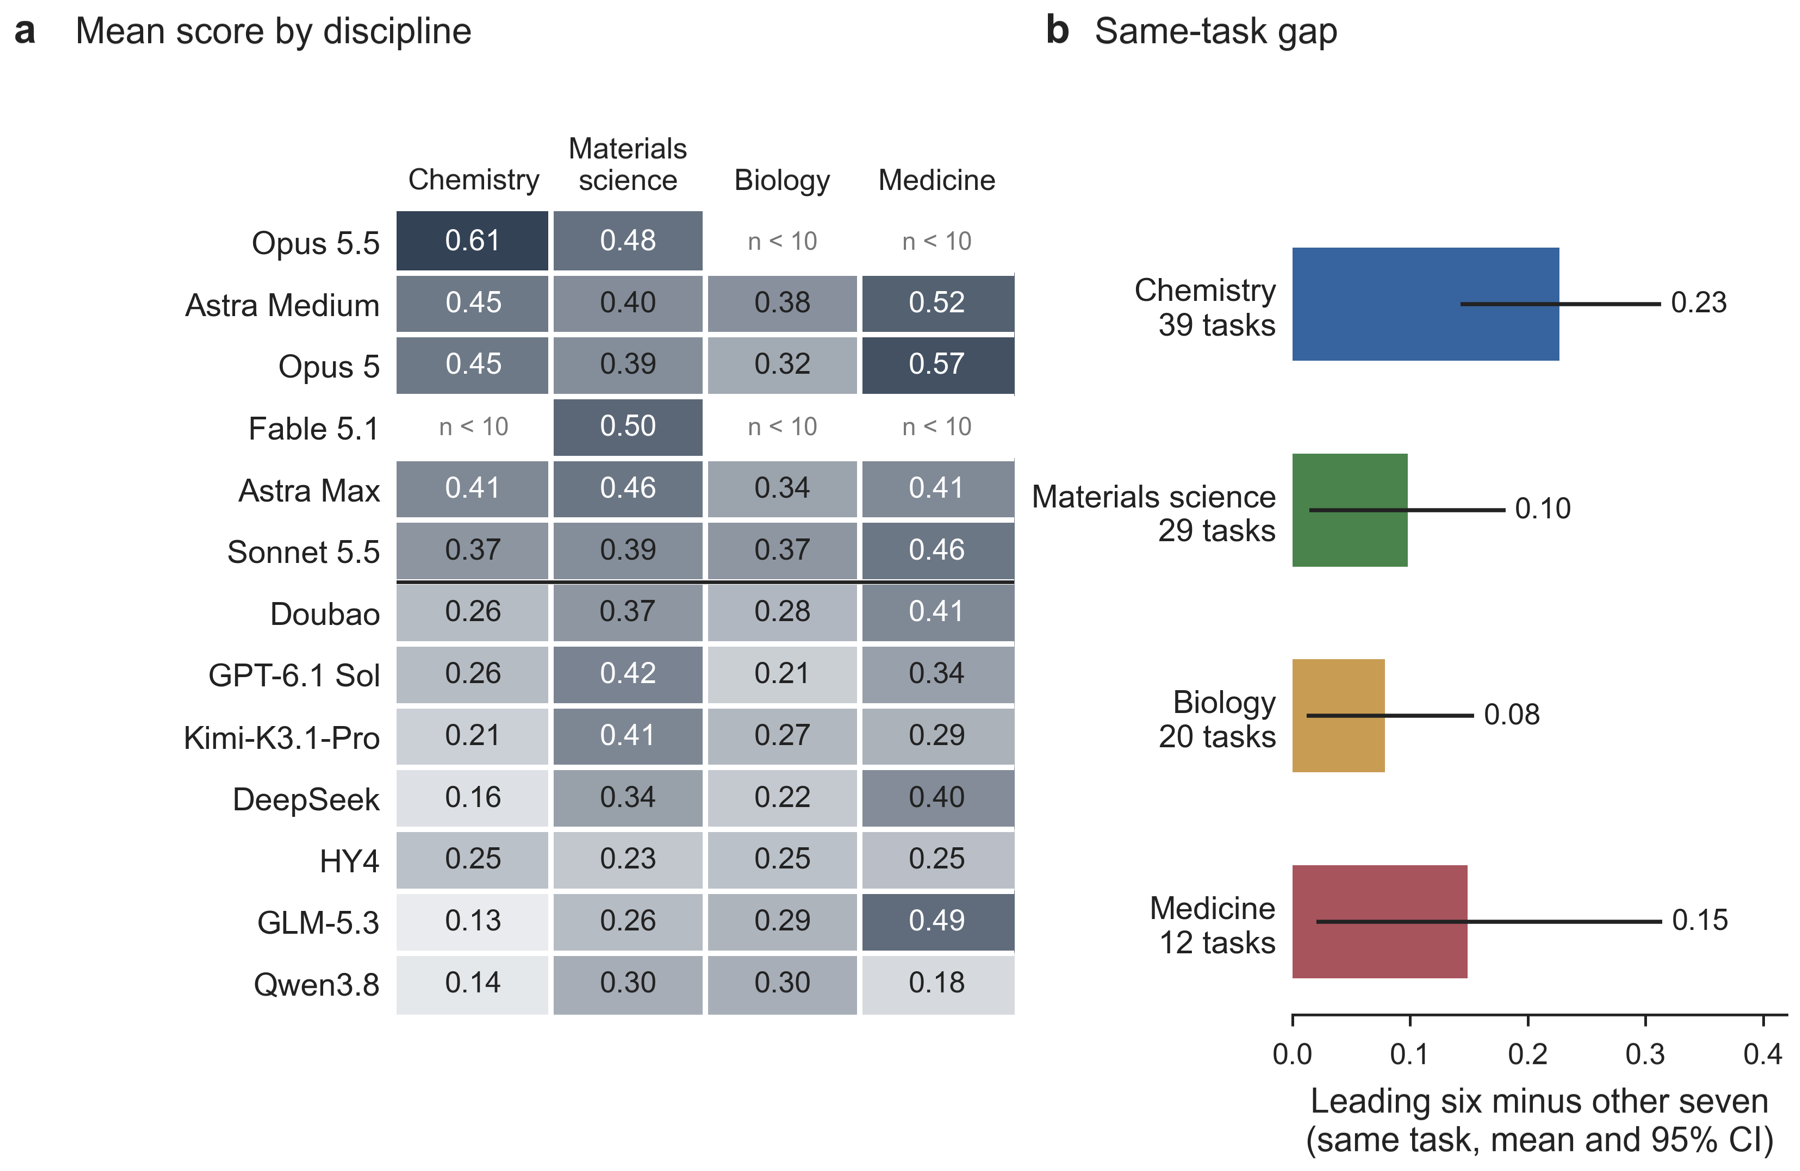
The 100 public tasks span chemistry (39), materials science (29), biology (20) and medicine (12). Over all scored runs, medicine averages 0.394 and materials science 0.378, against 0.294 in chemistry and 0.290 in biology.
The best configuration differs in each: Claude Opus 5.5 in chemistry, Claude Fable 5.1 in materials science, GPT-6 Astra (medium) in biology and Claude Opus 5 in medicine. Chemistry separates the configurations most, with the leading six scoring about twice as high as the other seven; in materials science GPT-6.1 Sol and Kimi-K3.1-Pro come close to the leading six; biology spreads the configurations least; and in medicine GLM-5.3, near the bottom overall, is third (a).
On the same tasks, the leading six score 0.23 above the other seven in chemistry, 0.15 in medicine, 0.10 in materials science and 0.08 in biology (b). Shuffling the discipline labels of the tasks often produces differences this large, so the variation between disciplines is not statistically detectable.
Two runs side by side
Same solvents, different question: Claude Opus 5.5 and Qwen3.8
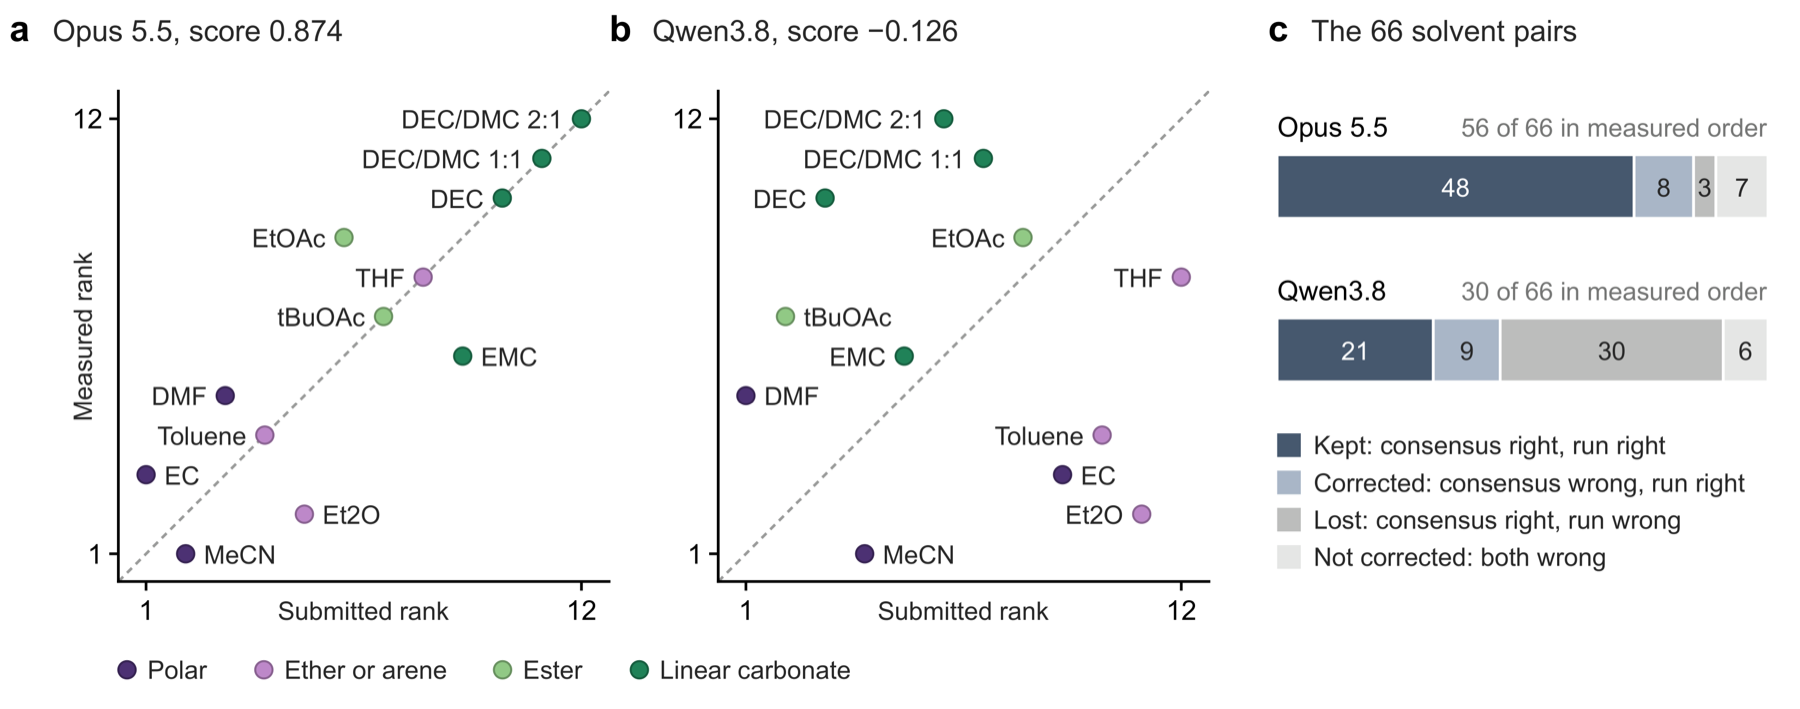
One chemistry task ranks twelve solvents by the isolated mass of a polymer: the same polymerization, run in each solvent. Claude Opus 5.5 scored 0.874, the best on this task; Qwen3.8 scored −0.126, below random. Of the 66 solvent pairs, Opus 5.5 put 56 in the measured order and Qwen3.8 30.
The two runs disagreed from the first step about what controls the yield. Qwen3.8 decided that it was how much ethylene, one of the monomers, each solvent dissolves, and ranked by ethylene solubility, putting diethyl ether, THF and toluene at the top. Opus 5.5 listed every way the solvent could affect the yield and checked each in turn. Most solvents dissolve similar amounts of ethylene, so that quantity cannot separate them; what differs is whether the solvent mixes with the comonomer and the catalyst. Opus 5.5 therefore put the three polar solvents last and the carbonates first, which is the measured trend. It wrote its first ranking twenty minutes into the run, before any calculation, and that ranking already scored 0.790.
Qwen3.8 noticed evidence against its own ranking and did not act on it. It wrote that one solvent is a solid at the reaction temperature and that another may separate from the monomer, yet ranked the first ninth from the bottom, where the measurement puts it third. It also wrote that its model “mostly just reorders the input assumptions”, and the model gave seven solvents nearly the same yield, but it submitted the model’s order anyway. Against the consensus, the shared intuition got 51 pairs right; Opus 5.5 kept 48 of them and Qwen3.8 21. Of the 15 pairs the consensus got wrong, they corrected 8 and 9. The case shows the first two abilities: identifying which quantity decides the result, and judging whether one’s own calculation deserves trust.
The gap is not in compute: Claude Opus 5.5 and GLM-5.3-Flash
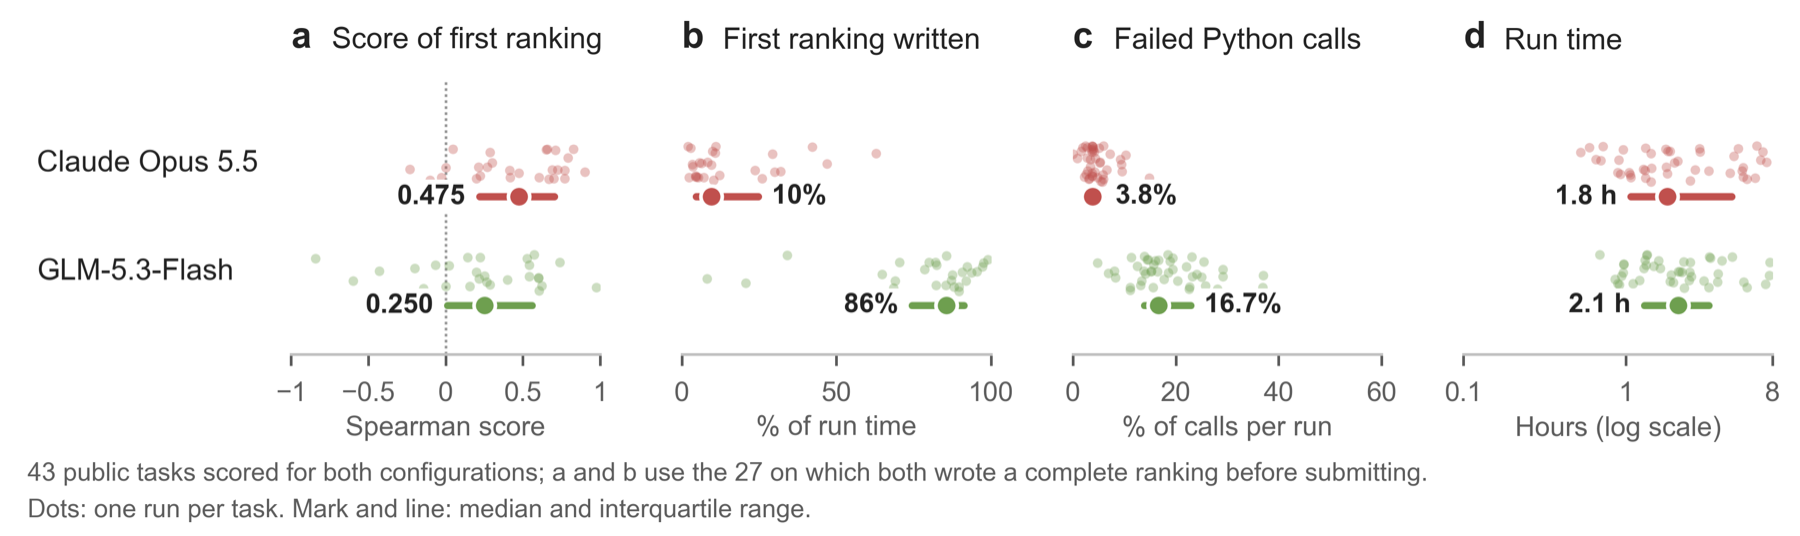
Claude Opus 5.5 and GLM-5.3-Flash sit at the two ends of the ranking: Opus 5.5 is first over all its scored tasks (0.486) and on the 28 shared tasks (0.525), and GLM-5.3 is last on both (0.237). We audited their trajectories on the 43 public tasks that both completed. Opus 5.5 scored higher on 31 of them, by 0.29 on average.
Effort is not the reason. Their median runs last 1.8 and 2.1 hours, and they use the same methods: quantum chemistry, molecular simulation, Monte Carlo sampling and GPU computing at similar rates.
The difference is in judgment and execution (a–c). Opus 5.5 writes its first complete ranking at about 10% of the run and GLM-5.3 at about 86%; on the tasks where both wrote one, Opus 5.5’s first ranking already scores 0.475 (median) against 0.250 for GLM-5.3, and later revisions change little for either. A median Opus 5.5 run has 3.8% of its Python calls fail, against 16.7% for GLM-5.3, mostly bugs in its own code: wrong keys, types or array shapes.
Underneath is the second ability. Opus 5.5 usually models the quantity the experiment measured; GLM-5.3 often points the right tools at the wrong object. On a cobalt-catalyzed polymerization task, both ranked ligands by the strength of the cobalt–carbon bond, and Opus 5.5 scored 0.771 while GLM-5.3’s calculation pointed the opposite way and scored −0.429. When GLM-5.3 does compute the measured quantity, it can win: on a copper–gold electrode task it relaxed 377 alloy surfaces, reproduced the measured order among the copper-rich electrodes and scored 0.543 against −0.029 for Opus 5.5.
What helps a prediction, and what does not
When the answer cannot be looked up, agents still beat chance
Public tasks come from published papers, which an agent could in principle find or remember. The private tasks cannot be: their results have never been published, so no search returns them and no training corpus contains them. They test prediction with retrieval ruled out.
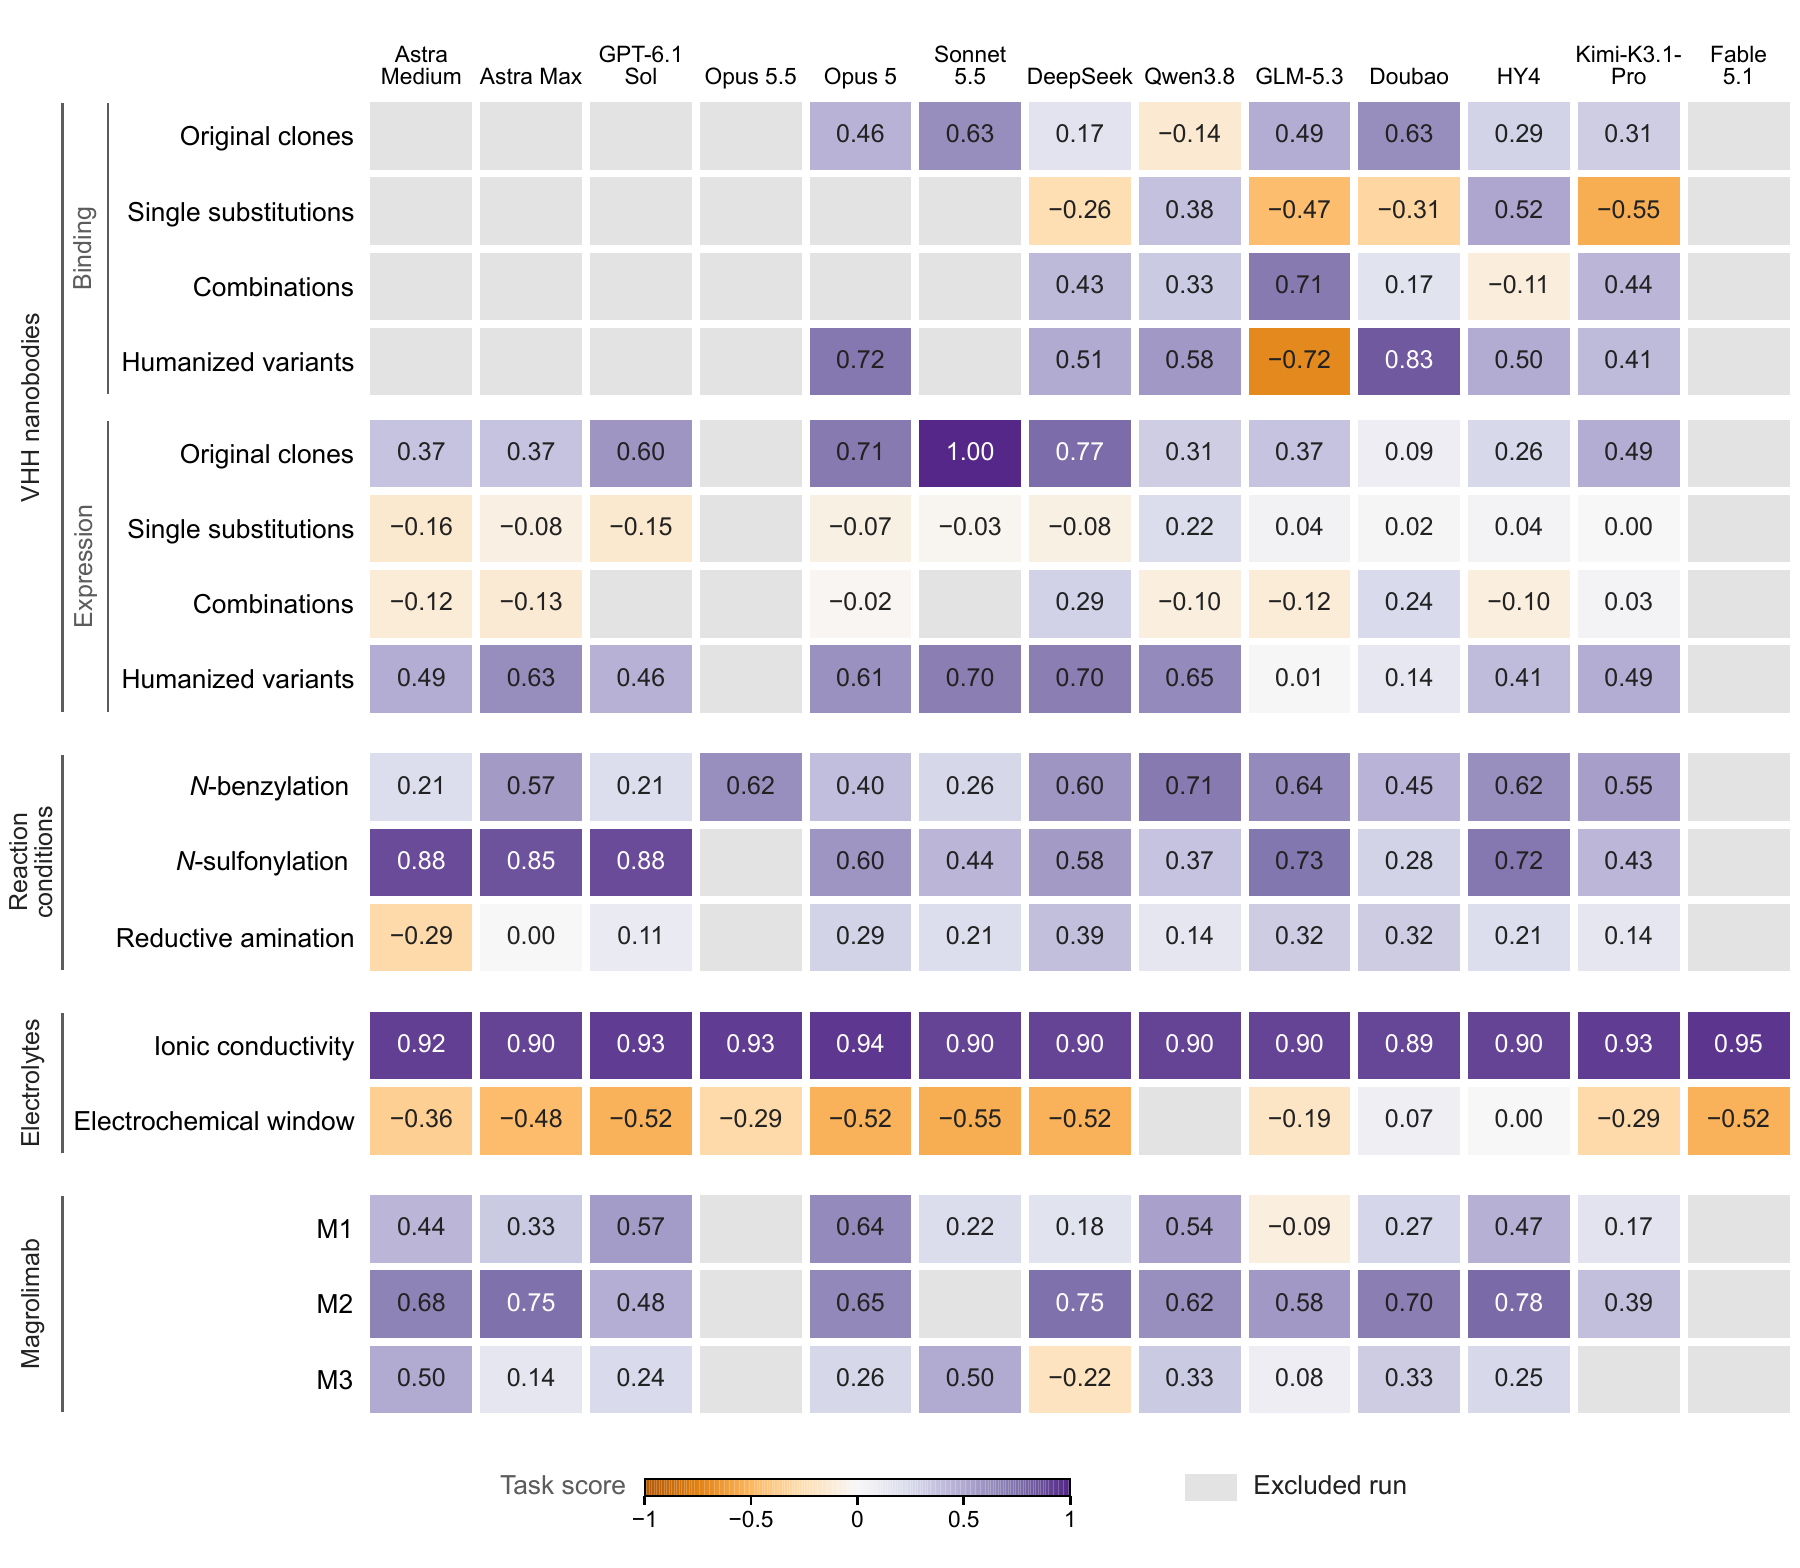
Across the 16 private tasks, 159 of 208 official runs were scored, and twelve of the thirteen configurations rank significantly better than chance. Even with nothing to look up, the agents draw useful predictions from what they know and what they compute.
How well they do depends on what is measured. On the same electrolyte series, all thirteen configurations rank ionic conductivity almost perfectly (Spearman 0.89 to 0.95), but on the electrochemical window of the same solutions the twelve scored configurations range from −0.55 to 0.07, and none beats chance.
More reasoning effort did not bring better predictions
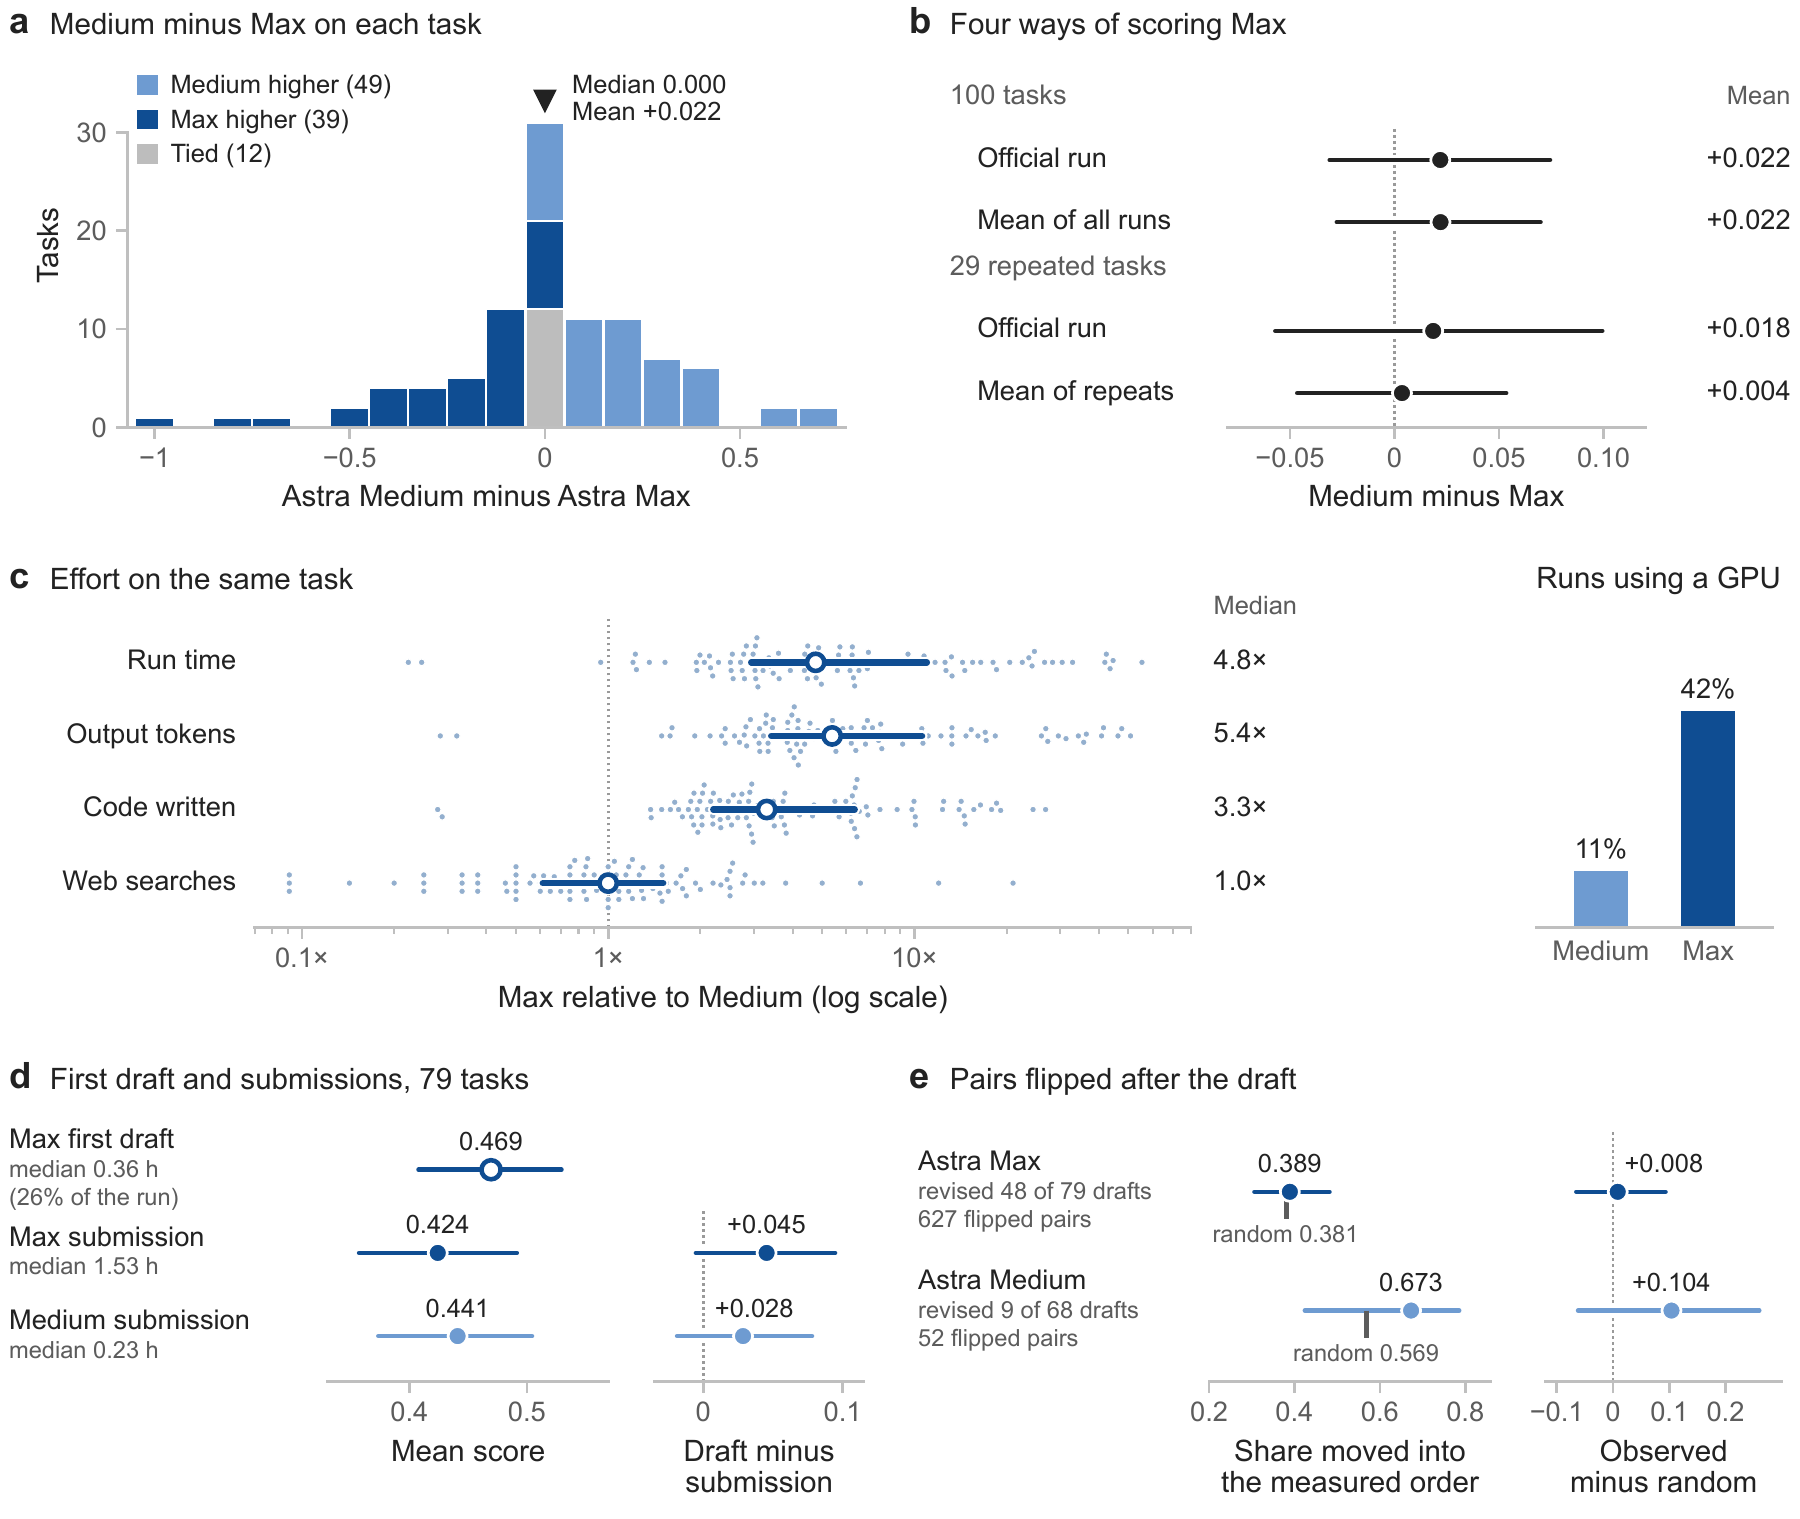
We ran GPT-6 Astra at medium and at max reasoning effort. On the same task, max effort runs 4.8 times longer and costs 5.3 times more (medians of the ratios), with no detectable gain in score.
On 79 tasks we recovered the first complete ranking of the max-effort run. It appears at a median of 26% of the run and scores 0.469 on average; the final submission scores 0.424, a difference that is not significant. The extra hours did not improve the answer.
Using more tools does not make a prediction more accurate
Configurations differ mainly in how many kinds of method they use. GPT-6 Astra at max effort uses a median of four method families per run and at medium effort one, yet, as above, the two score the same. Three more kinds of method did not buy accuracy.
The most common tool is rarely aimed at the experiment either. Monte Carlo sampling appears in nearly three-quarters of runs, mostly to put error bars on a ranking rather than to model the experiment itself.
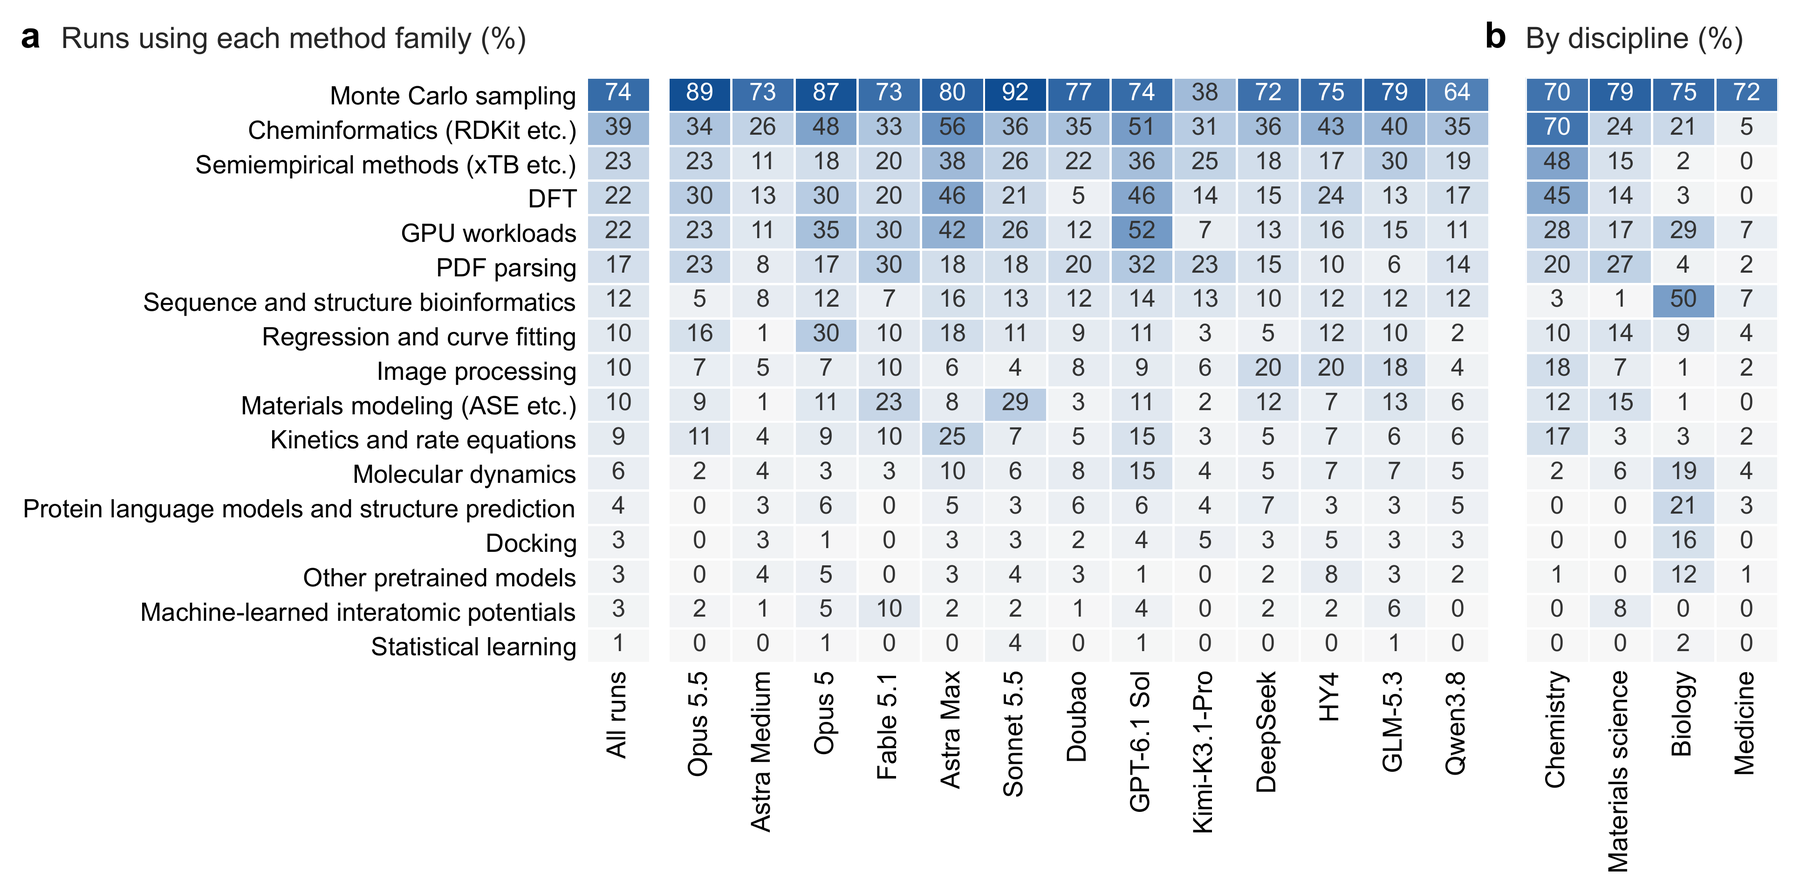
Which tools a run uses is decided by the discipline of the task. Cheminformatics, semiempirical quantum chemistry and DFT concentrate in chemistry, sequence and structure bioinformatics in biology, and medicine tasks rarely call a physical simulation at all. Two runs of GPT-6 Astra (max) on the same task share most of their methods (mean Jaccard similarity 0.65), against 0.29 for runs on different tasks.
Almost every run checks the GPU; about one in five uses it
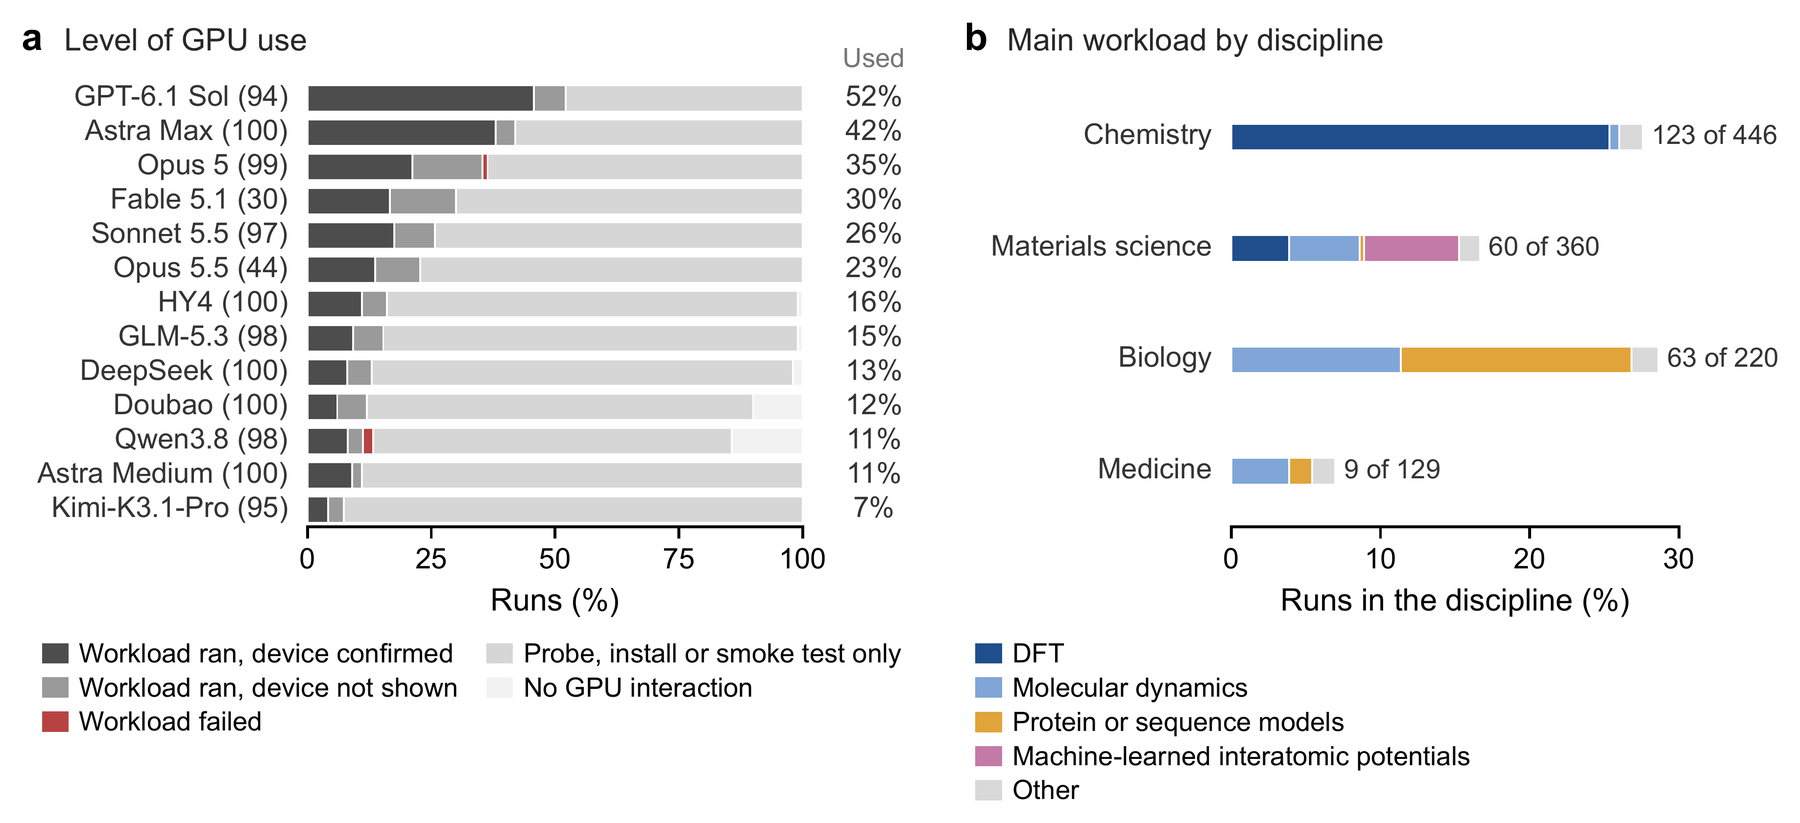
Each run has one NVIDIA H20 GPU, and the instructions ask the agent to check the hardware first. 98% of runs probed the GPU, but only 255 (22%) completed a GPU workload, from 7% of Kimi-K3.1-Pro runs to 52% of GPT-6.1 Sol runs. Half of those workloads are DFT, followed by molecular dynamics, protein and sequence models and machine-learned interatomic potentials, again following the discipline of the task.
The cost is real: runs that used the GPU took a median of 4.9 hours against 1.0 hour for the rest, and 36% of the runs that started a GPU workload hit a GPU error, most often a CUDA library that failed to load. The return is small at best: compared with other runs of the same configuration on the same tasks, runs with a GPU workload score 0.035 higher, with a 95% interval from −0.019 to 0.090 that includes zero. The GPU made a chosen quantity faster to compute without bringing it closer to what the experiment measured.
Can't an agent just look the answer up?
Public tasks come from published papers and the agents are online, so SPU has four safeguards. The source papers are recent. The instructions forbid the source study, its supplementary materials and data, and recalling its results; every search and download goes through audited tools, and an agent whose search turns up a forbidden result must stop and record it. Scoring happens in an isolated container without network access, and every trajectory is kept for review. And the private tasks cannot be found online at all.
We checked all 1,300 official runs. No run searched for its source paper. In 110 runs a tool returned an identifier of the source study, such as its DOI or title, which shows that a tool returned it, not that the run used it; 46 runs saw the source DOI, and 40 of them recorded it in their report as required. These runs gained no advantage: 41% of them beat the chance threshold, against 42% of the others, and relative to other runs of the same configuration they score 0.053 higher on average, a difference that is not significant and is small next to the 0.14 to 0.29 that separates the two groups of configurations.
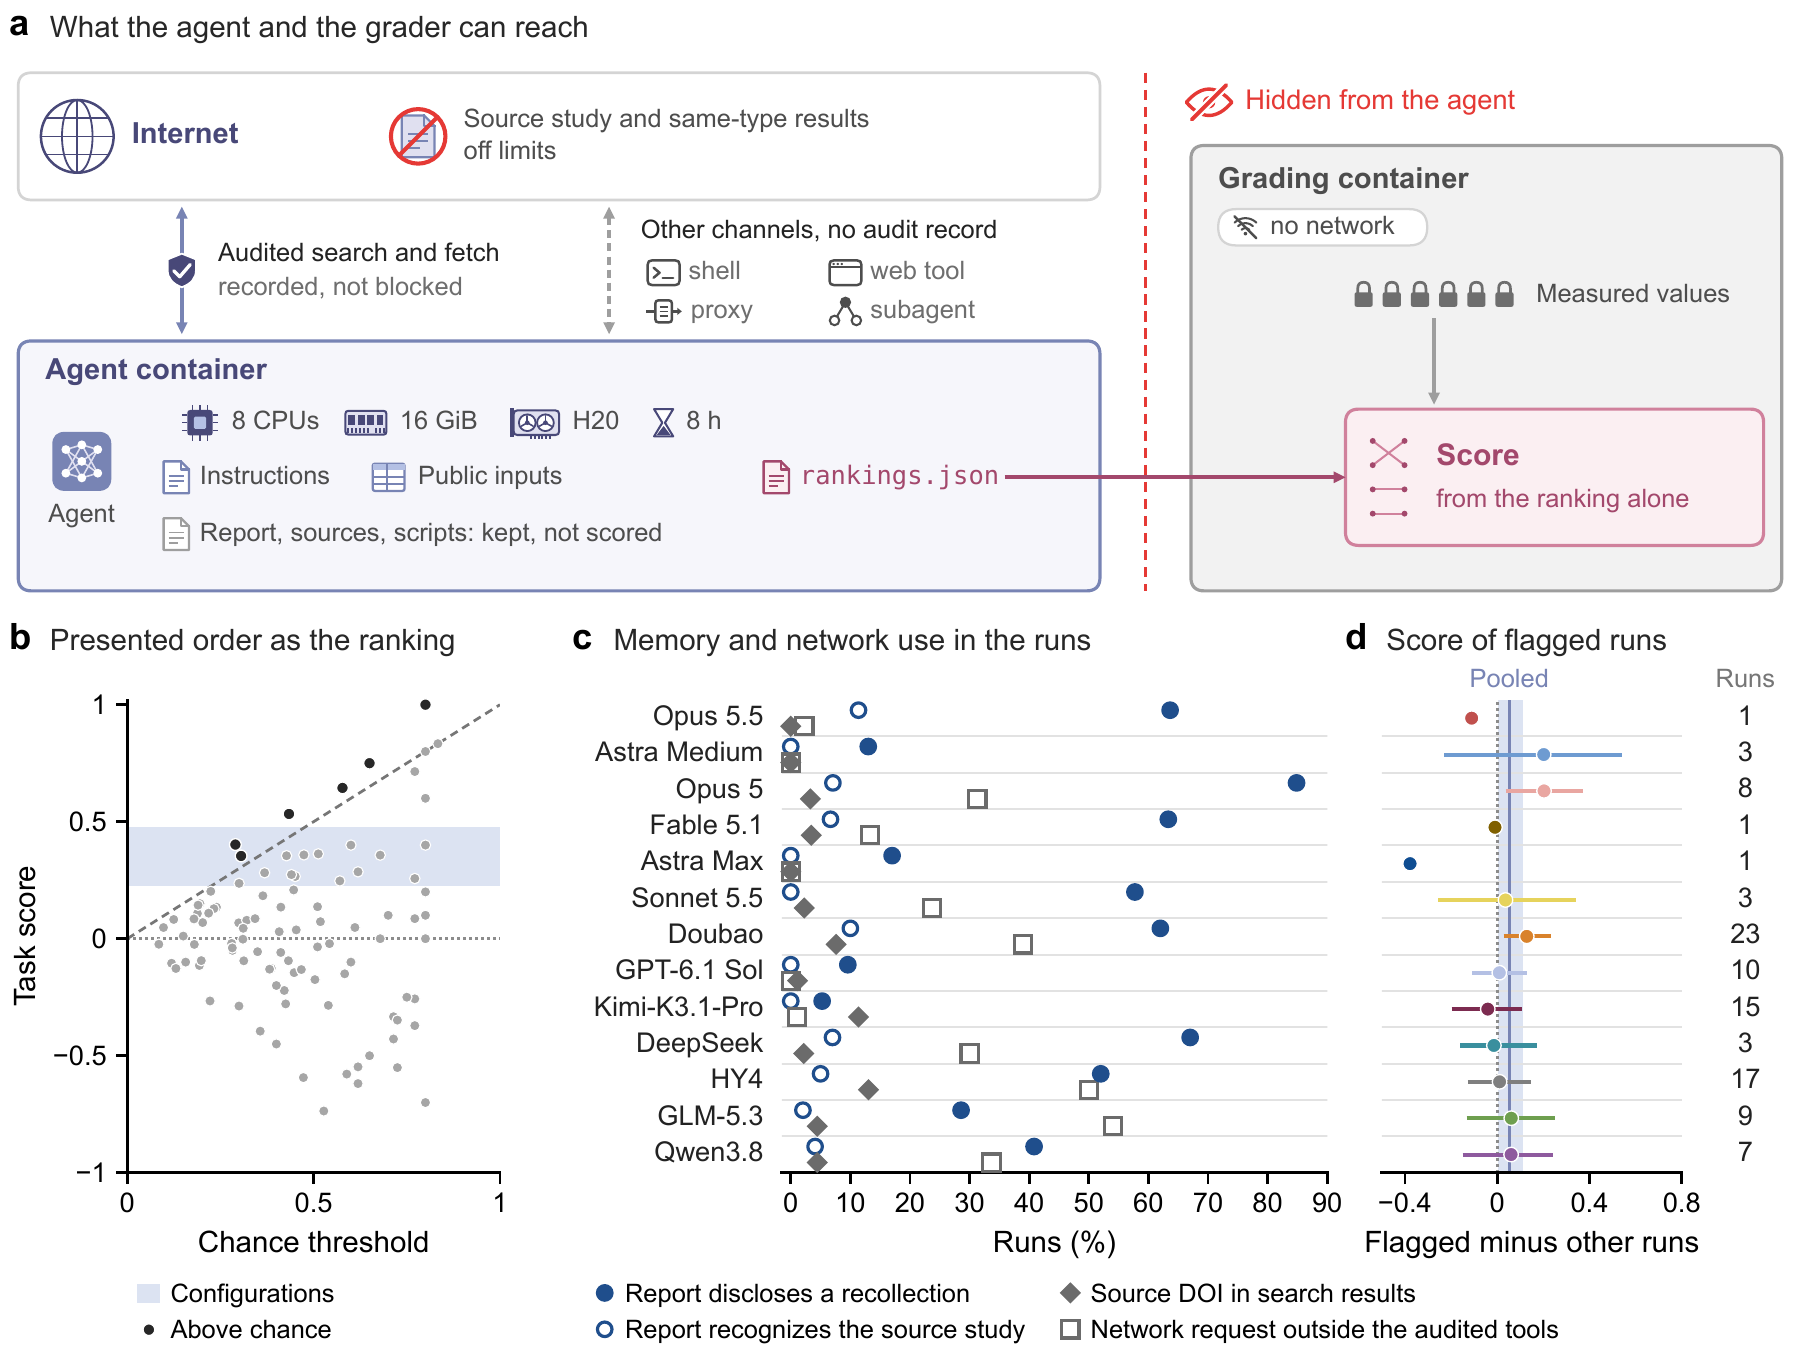
The simplest shortcut fails too: submitting the experiments in the order they are presented scores 0.030 on average, below every configuration, and beats the chance threshold about as often as a random ranking. These checks cannot rule out contamination of the public tasks entirely, which is why SPU keeps private tasks: on them, with nothing to retrieve, twelve of the thirteen configurations still beat chance.
100 public tasks, 16 private tasks
100 · Public tasks
The complete Harbor task packages, including task inputs, environments, scoring code and reference answers, are released on Hugging Face so others can run and score them independently. During evaluation, reference answers stay in a separate grading container, hidden from the agent. Published results may eventually enter training data, so evaluation reports should state each model's training cutoff.
16 · Private tasks
These stay private for controlled evaluation. Their experimental measurements are unpublished and kept out of the public task release. We plan to add more private tasks over time and to retire public tasks if we detect contamination.
Agents need to identify what controls a measurement.
Within the eight-hour budget studied here, longer runs and heavier simulations did not bring a detectable improvement in prediction accuracy. To close the gap between computation and real experiments, agents will need to work out which mechanism controls a measured result and test their own physical assumptions before committing to a prediction.
Citation
If you use SPU, please cite the paper:
@misc{spu2026,
  title         = {Science Prediction Universe},
  author        = {Tu, Zengji and Liu, Xiang and Sun, Jiarui and Wu, Ruoyu and Qi, Zhihui and Wu, Chengda and Zhou, Yutao and Yang, Bo and Zhang, Ziyan and Wu, Jialong and Chen, Liang and Li, Kuan and Dillmann, Steven and Du, Yuanqi and Yang, Soojung and Diao, Shizhe and Wu, Jianjun and Liu, Junlang and Hu, Xuming and Chang, Lin and Chang, Baobao and Chu, Xiaowen and Yu, Philip S. and Zhang, Tong-Yi and Cheng, Hao and Han, Qin and Feng, Yanye and Duan, Chenru and Liu, Chuncheng and Liu, Yan and Gao, Yuchen and Li, Zhao and Zhang, Ronghua and Xu, Tory and Song, Renjian and Fu, Yaokai},
  year          = {2026},
  eprint        = {2611.15049},
  archivePrefix = {arXiv},
  primaryClass  = {cs.AI},
  url           = {https://arxiv.org/abs/2611.15049},
  note          = {Project page: https://spu.unipat.ai}
}
Contributors
Project Team
Advisory Committee
Wet-Lab Collaborators
Affiliations
 UniPat AI
 Stanford University
 Cornell University
 FutureHouse
 The Hong Kong University of Science and Technology
 State Key Laboratory of Photonics and Communications, School of Electronics, Peking University
 Department of Chemistry and Chemical Biology, Harvard University
- The Hong Kong University of Science and Technology (Guangzhou)
- Frontiers Science Center for Nano-optoelectronics, Peking University
- Peking University
 University of Illinois Chicago
 Shanghai University
 Yurogen Biosystems LLC
 ABclonal Biotechnology Co., Ltd.
 Deep Principle
 Bota Biosciences
*Core contributors. †Corresponding authors: Liang Chen (liangchen@unipat.ai), Kuan Li (kuanli@unipat.ai), Lin Chang. ‡Project leader: Liang Chen.
Contribute an experiment.
If your lab has unpublished experiments that could become private tasks, we would like to hear from you at contact@unipat.ai.